一:背景
1. 讲故事
很多朋友可能会有疑问,C# 是一门托管语言,怎么可能会有非托管句柄泄露呢? 其实一旦 C# 程序与 C++ 语言交互之后,往往就会被后者拖入非托管泥潭,让我们这些调试者被迫探究 非托管领域问题。
二:非托管句柄泄露
1. 测试案例
为了方便讲述,我们上一个 Event 泄露的案例,使用 C# 调用 C++ ,然后让 C++ 产生 bug 导致句柄泄露。
先看一下 C++ 代码
extern "C"
{
_declspec(dllexport) void CSharpCreateEvent();
}
#include "iostream"
#include 然后导出一个 CSharpCreateEvent 方法给 C# 使用。
    internal class Program
    {

        [DllImport("Example_20_1_5", CallingConvention = CallingConvention.Cdecl)]
        extern static void CSharpCreateEvent();

        static void Main(string[] args)
        {
            try
            {
                while (true)
                {
                    Task.Run(() =>
                    {
                        CSharpCreateEvent();
                    });

                    Thread.Sleep(10);
                }
            }
            catch (Exception ex)
            {
                Console.WriteLine(ex.Message);
            }

            Console.ReadLine();
        }
    }
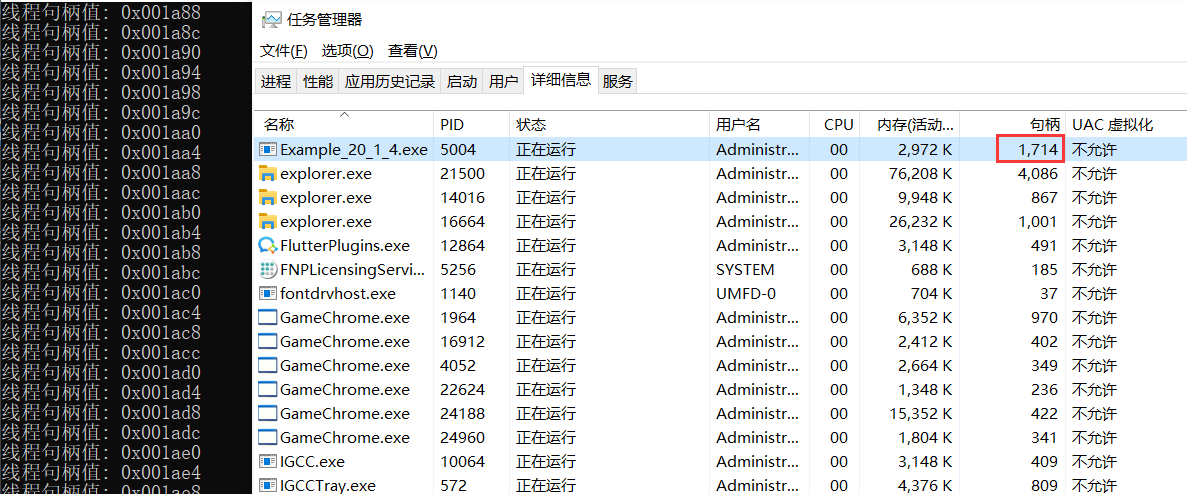
程序跑起来后,在任务管理器中会发现这个句柄在不断的上涨,截图如下:
2. 到底是谁在泄露
如果你的生产环境可以用 WinDbg 附加进程,那用它就可以轻松解决,可以借助 !handle 命令看一下泄露的句柄类型。
0:004> !handle
...
Handle 16fc
  Type         	Event
1411 Handles
Type           	Count
None           	6
Event          	1337
File           	16
Directory      	4
Mutant         	3
WindowStation  	2
Semaphore      	5
Key            	10
Thread         	8
Desktop        	1
IoCompletion   	5
TpWorkerFactory	3
ALPC Port      	1
WaitCompletionPacket	10
从统计信息看,当前 Event 高达 1337 个,看样子程序存在 Event 泄露,接下来我们就要洞察到底是谁分配的 Event,如果能找到分配 Event 的线程栈,那这个问题就会迎刃而解,对吧,有 WinDbg 在,方圆3公里的bug都要移民,追踪调用栈可以使用 WinDbg 提供的 !htrace 命令。
它的原理很简单,一句话表示就是:挖出现在时间点和快照之间那些没有被 free 处理的 handle 调用栈,结果一清二楚,参考代码如下:
0:011> !htrace -enable
Handle tracing enabled.
Handle tracing information snapshot successfully taken.

0:011> g
(e14.90c0): Break instruction exception - code 80000003 (first chance)
eax=006f2000 ebx=00000000 ecx=7777dfe0 edx=10088020 esi=7777dfe0 edi=7777dfe0
eip=77744e50 esp=0811f97c ebp=0811f9a8 iopl=0         nv up ei pl zr na pe nc
cs=0023  ss=002b  ds=002b  es=002b  fs=0053  gs=002b             efl=00000246
ntdll!DbgBreakPoint:
77744e50 cc              int     3

0:007> !htrace -diff
Handle tracing information snapshot successfully taken.
0xad new stack traces since the previous snapshot.
Ignoring handles that were already closed...
Outstanding handles opened since the previous snapshot:
--------------------------------------
Handle = 0x0000199c - OPEN
Thread ID = 0x000017c8, Process ID = 0x00000e14

0x4ac3d761: +0x4ac3d761
0x4aa0d9f5: +0x4aa0d9f5
0x6674d9c4: +0x6674d9c4
0x66547f33: +0x66547f33
0x6654901a: +0x6654901a
0x776c17c3: +0x776c17c3
0x776c11b9: +0x776c11b9
0x665438c9: +0x665438c9
0x665432bd: +0x665432bd
0x66725089: +0x66725089
0x66724c73: +0x66724c73
0x66724c1e: +0x66724c1e
0x77742f7c: ntdll!NtCreateEvent+0x0000000c
0x770f5746: KERNELBASE!CreateEventExW+0x00000056
0x770e2b04: KERNELBASE!CreateEventW+0x00000024
*** WARNING: Unable to verify checksum for D:\skyfly\20.20230628\src\Example\Example_20_1_4\bin\x86\Debug\net6.0\Example_20_1_5.DLL
0x6ac91755: Example_20_1_5!CSharpCreateEvent+0x00000035
--------------------------------------
...

Displayed 0xaa stack traces for outstanding handles opened since the previous snapshot.
从卦中短暂的时间内快照之间有 170 个句柄没有被释放,而且从调用栈看是 Example_20_1_5!CSharpCreateEvent 方法所致,但这里有一个问题,虽然有非托管栈,但没有看到任何托管部分,那怎么办呢?
3. 如何洞察到托管栈
其实这个问题很简单,既然都 WinDbg 附加了,干脆用 bp 下断点,后续泄露之时必然会被命中,然后通过 !clrstack 或者 k 观察线程栈即可,有了思路就开干。
:007> bp Example_20_1_5!CSharpCreateEvent "k; gc"
breakpoint 0 redefined
0:007> g
 # ChildEBP RetAddr
00 0848f9e4 080674f3     Example_20_1_5!CSharpCreateEvent [D:\skyfly\20.20230628\src\Example\Example_20_1_5\Example_20_1_5.cpp @ 15]
WARNING: Frame IP not in any known module. Following frames may be wrong.
01 0848f9e4 0806748b     0x80674f3
02 0848f9f0 0806e3dd     Example_20_1_4!Example_20_1_4.Program.<>c.b__1_0+0x1b
03 0848f9fc 0806e38d     System_Private_CoreLib!System.Threading.Tasks.Task.InnerInvoke+0x3d
04 0848fa04 0806e307     System_Private_CoreLib!System.Threading.Tasks.Task.<>c.<.cctor>b__272_0+0xd
05 0848fa2c 0806e072     System_Private_CoreLib!System.Threading.ExecutionContext.RunFromThreadPoolDispatchLoop+0x37
06 0848fa94 0806c49f     System_Private_CoreLib!System.Threading.Tasks.Task.ExecuteWithThreadLocal+0x82
07 0848faec 6b22f2bc     System_Private_CoreLib!System.Threading.ThreadPoolWorkQueue.Dispatch+0x1bf
08 0848fb88 6b216595     System_Private_CoreLib!System.Threading.PortableThreadPool.WorkerThread.WorkerThreadStart+0xdc [/_/src/libraries/System.Private.CoreLib/src/System/Threading/PortableThreadPool.WorkerThread.cs @ 63]
09 0848fb98 6c00c30f     System_Private_CoreLib!System.Threading.Thread.StartCallback+0x35 [/_/src/coreclr/System.Private.CoreLib/src/System/Threading/Thread.CoreCLR.cs @ 106]
0a 0848fba4 6bf5c07b     coreclr!CallDescrWorkerInternal+0x34
0b 0848fbd8 6bf6799a     coreclr!CallDescrWorkerWithHandler+0x66 [D:\a\_work\1\s\src\coreclr\vm\callhelpers.cpp @ 69]
0c 0848fc20 6bff619b     coreclr!DispatchCallSimple+0x7f [D:\a\_work\1\s\src\coreclr\vm\callhelpers.cpp @ 220]
0d 0848fc44 6bf7c7df     coreclr!ThreadNative::KickOffThread_Worker+0x4b [D:\a\_work\1\s\src\coreclr\vm\comsynchronizable.cpp @ 158]
0e (Inline) --------     coreclr!ManagedThreadBase_DispatchInner+0x3d [D:\a\_work\1\s\src\coreclr\vm\threads.cpp @ 7321]
0f 0848fcc8 6bf7c70f     coreclr!ManagedThreadBase_DispatchMiddle+0x8c [D:\a\_work\1\s\src\coreclr\vm\threads.cpp @ 7365]
10 0848fd20 6bf1116f     coreclr!ManagedThreadBase_DispatchOuter+0x62 [D:\a\_work\1\s\src\coreclr\vm\threads.cpp @ 7543]
11 (Inline) --------     coreclr!ManagedThreadBase_FullTransition+0x21 [D:\a\_work\1\s\src\coreclr\vm\threads.cpp @ 7569]
12 (Inline) --------     coreclr!ManagedThreadBase::KickOff+0x21 [D:\a\_work\1\s\src\coreclr\vm\threads.cpp @ 7604]
13 0848fd54 755b00f9     coreclr!ThreadNative::KickOffThread+0x7f [D:\a\_work\1\s\src\coreclr\vm\comsynchronizable.cpp @ 230]
14 0848fd64 77737bbe     KERNEL32!BaseThreadInitThunk+0x19
15 0848fdc0 77737b8e     ntdll!__RtlUserThreadStart+0x2f
16 0848fdd0 00000000     ntdll!_RtlUserThreadStart+0x1b
...
从卦中看,一切都非常明白,这里再补充一点,如果想中途再产生 快照,可以用 -snapshot 命令创建一个初始点,参考如下:
0:007> !htrace -snapshot
Handle tracing information snapshot successfully taken.
三:总结
handle 泄露也是一个比较难搞的问题,难点在于生产环境可能不让你用 WinDbg 这种侵入方式,但问题还得要解决,必须创造条件上,当前除了 WinDbg 还没有找到其他方式,有机会再研究下吧。