-
Echarts设置参数
经常根据设计图来调整Echarts的样式图,设置参数太多每次都需要调整,为了方便后续使用,特写此文章。
汽车仪表盘
option= { series: [ { name: "Pressure", type: "gauge", startAngle: 90, endAngle: -360, axisLine: { lineStyle: { width: 30, color: [ [0.1, "#FF9796"], [0.3, "#FBC32A"], [0.5, "#50C687"], [0.7, "#43A9E0"], [1, "#3F5CAD"], ], }, }, pointer: { show: false, }, splitLine: { show: false, distance: 0, length: 10, }, axisTick: { show: false, }, //刻度 axisLabel: { show: false, distance: 50, }, data: [ { value: [11, 22, 50], name: "SCORE", //上面标题 title: { fontSize: 14, fontWeight: 700, }, //下面文字 detail: { width: 60, height: 20, fontSize: 14, formatter: "表现力", }, }, ], }, ], }- 1
- 2
- 3
- 4
- 5
- 6
- 7
- 8
- 9
- 10
- 11
- 12
- 13
- 14
- 15
- 16
- 17
- 18
- 19
- 20
- 21
- 22
- 23
- 24
- 25
- 26
- 27
- 28
- 29
- 30
- 31
- 32
- 33
- 34
- 35
- 36
- 37
- 38
- 39
- 40
- 41
- 42
- 43
- 44
- 45
- 46
- 47
- 48
- 49
- 50
- 51
- 52
- 53
- 54
- 55
- 56
- 57
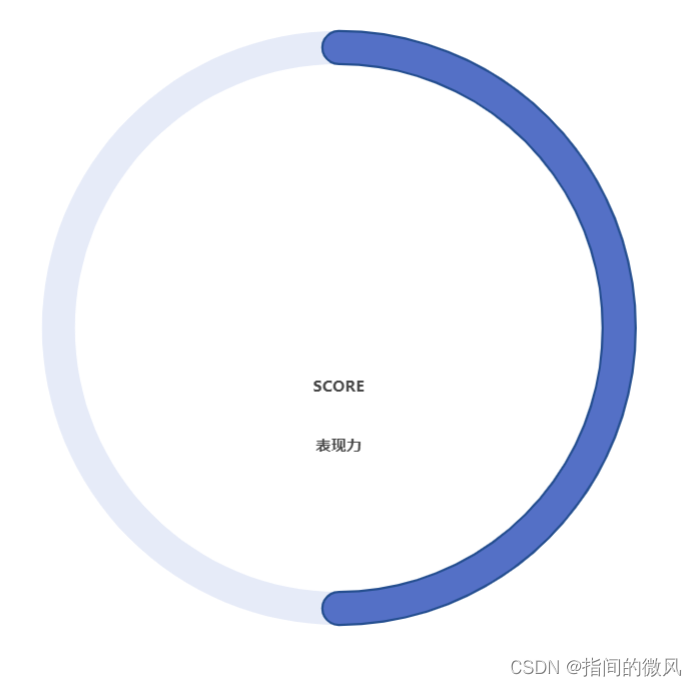
示例图:

option = { series: [ { name: 'Pressure', type: 'gauge', startAngle: 90, endAngle: -360, pointer: { show: false }, progress: { show: true, overlap: false, roundCap: true, clip: false, itemStyle: { borderWidth: 2, borderColor: '#244E8F' } }, axisLine: { lineStyle: { width: 30 } }, splitLine: { show: false, distance: 0, length: 10 }, axisTick: { show: false }, //刻度 axisLabel: { show: false, distance: 50 }, data: [ { value: 50, name: 'SCORE', //上面标题 title: { fontSize: 14, fontWeight: 700 }, //下面文字 detail: { width: 60, height: 20, fontSize: 14, formatter: '表现力' } } ] } ] }- 1
- 2
- 3
- 4
- 5
- 6
- 7
- 8
- 9
- 10
- 11
- 12
- 13
- 14
- 15
- 16
- 17
- 18
- 19
- 20
- 21
- 22
- 23
- 24
- 25
- 26
- 27
- 28
- 29
- 30
- 31
- 32
- 33
- 34
- 35
- 36
- 37
- 38
- 39
- 40
- 41
- 42
- 43
- 44
- 45
- 46
- 47
- 48
- 49
- 50
- 51
- 52
- 53
- 54
- 55
- 56
- 57
- 58
- 59
示例图:

雷达图
option= { color: ["#E51924", "#2773D5"], radar: { shape: "circle", indicator: [ { name: "Sales", max: 6500 }, { name: "Admin", max: 6500 }, { name: "Informaty", max: 6500 }, { name: "Custome", max: 6500 }, { name: "Develont", max: 6500 }, { name: "Marketing", max: 6500 }, ], axisName: { color: "#333", fontSize: 14, fontWeight: 700, }, }, series: [ { name: "Budget vs spending", type: "radar", data: [ { value: [4200, 3000, 2000, 3500, 6000, 1800], name: "红队", lineStyle: { color: "#E51924", opacity: 0.8, }, symbolSize: 0, areaStyle: { color: "#E51924", }, }, { value: [5000, 1400, 2800, 2600, 4200, 2100], name: "蓝队", symbolSize: 0, lineStyle: { color: "#2773D5", opacity: 0.8, }, areaStyle: { color: "#2773D5", }, }, ], }, ], },- 1
- 2
- 3
- 4
- 5
- 6
- 7
- 8
- 9
- 10
- 11
- 12
- 13
- 14
- 15
- 16
- 17
- 18
- 19
- 20
- 21
- 22
- 23
- 24
- 25
- 26
- 27
- 28
- 29
- 30
- 31
- 32
- 33
- 34
- 35
- 36
- 37
- 38
- 39
- 40
- 41
- 42
- 43
- 44
- 45
- 46
- 47
- 48
- 49
- 50
- 51
示例图:

线性图
lineOption: { visualMap: [ { show: false, type: "continuous", seriesIndex: 0, min: 0, }, ], tooltip: { trigger: "axis", }, xAxis: { type: "category", data: ["A", "B", "C"], }, yAxis: { type: "value", }, grid: [ { bottom: "10%", }, { top: "10%", }, ], series: [ { type: "line", showSymbol: false, data: [0, 3, 4, 23, 0], }, ], },- 1
- 2
- 3
- 4
- 5
- 6
- 7
- 8
- 9
- 10
- 11
- 12
- 13
- 14
- 15
- 16
- 17
- 18
- 19
- 20
- 21
- 22
- 23
- 24
- 25
- 26
- 27
- 28
- 29
- 30
- 31
- 32
- 33
- 34
- 35

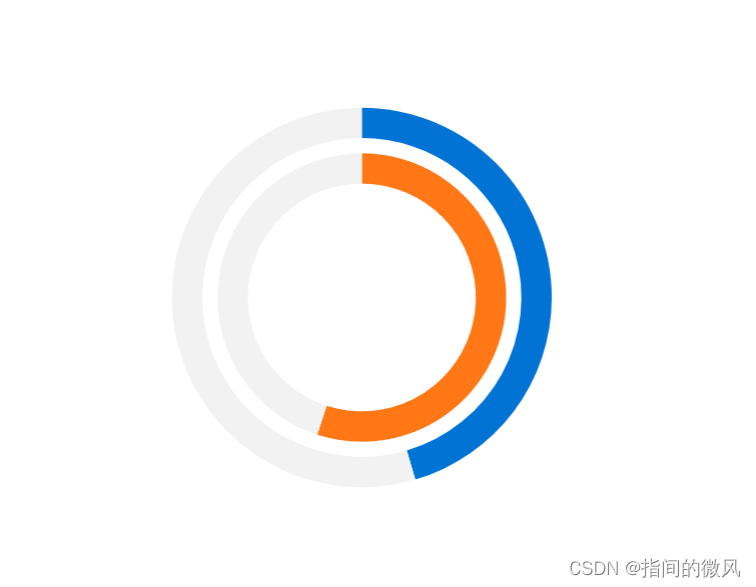
双饼图
option = { color:['#F2F2F2','#FF7815'], series: [ { name: '123', type: 'pie', radius: ['30%', '38%'], color:['#FF7815','#F2F2F2'], label: { show: false }, data: [ { value:110, name: '111' }, { value:90, name: 'F2F2F2' }, ] }, { name: '234', type: 'pie', radius: ['42%', '50%'], color:['#0073D5','#F2F2F2'], label: { show: false }, data: [ { value: 100, name: '999' }, { value: 120, name: '333' }, ] } ] };- 1
- 2
- 3
- 4
- 5
- 6
- 7
- 8
- 9
- 10
- 11
- 12
- 13
- 14
- 15
- 16
- 17
- 18
- 19
- 20
- 21
- 22
- 23
- 24
- 25
- 26
- 27
- 28
- 29
- 30
- 31
示意图:

-
相关阅读:
正则表达式中的*?与*的区别
中介子方程二十二
【动态规划刷题 16】最长等差数列 (有难度) && 等差数列划分 II - 子序列
力扣第79题 单词搜索
算法进阶-2sat-cf-1697F
Flink实时数仓同步:实时表、流水表、快照表整合实战详解
中国菜刀原理与实践
基于MSP430送药小车 ----- 拓展篇【2021年全国电赛(F题)】
让 Serverless 更普惠,阿里云函数计算 FC 宣布全面降价,最大幅度达 37.5%
cudnn-windows-x86_64-8.6.0.163_cuda11-archive 下载
- 原文地址:https://blog.csdn.net/thlchina/article/details/128201805
