-
python可视化----pyqtgraph
pyqtgraph 介绍
官网
基于numpy 、pyqt5、pyside2的纯python图形界面库。大部分绘图比matplotlib性能高。
跨平台性好
展示线、点、图像;
图形数据的快速实时更新;
交互式的平移、缩放
图片导出
画图样例
import pyqtgraph.examples
pyqtgraph.examples.run()使用pyqtgraph
- 查看案例
from pyqtgraph import examples examples.run()- 1
- 2
在弹出的窗口中,双击一个即可查看效果:

2. 在pyside2中使用pyqtgraph# __author__ = "laufing" # class_based_qt # laufing_qt # -*- coding: utf-8 -*- """ In this example we draw two different kinds of histogram. """ from PySide2.QtWidgets import QWidget, QApplication from PySide2.QtGui import QIcon, QPixmap, QPicture, QFont from PySide2.QtCore import QSize import pyqtgraph as pg from pyqtgraph.Qt import QtCore, QtGui import numpy as np ## Start Qt event loop unless running in interactive mode or using pyside. if __name__ == '__main__': import sys # if (sys.flags.interactive != 1) or not hasattr(QtCore, 'PYQT_VERSION'): # # 进入消息循环 # QtGui.QApplication.instance().exec_() app = QApplication(sys.argv) window = QWidget() window.resize(800, 600) window.move(200, 200) window.setWindowTitle("PySide2 案例") window.setWindowIcon(QIcon("./imgs/dog.jpg")) # *** # 实例化一个图形布局控件 win = pg.GraphicsLayoutWidget(window, show=True) win.resize(400, 250) print("窗口类型:", win) win.setWindowTitle('Histogram') # 添加一个图形 plt1 = win.addPlot() plt2 = win.addPlot() print("图形对象:", plt1) # np.random.normal 正态分布随机采样 # loc 均值 默认均值为0 # scale 标准差 默认标准差为1 属于标准正态分布 # size 采样的shape # np.hstack 水平拼接 一维数组 vals = np.hstack([np.random.normal(size=500), np.random.normal(size=260, loc=4)]) # 计算频数 freq, section = np.histogram(vals, bins=np.linspace(-3, 8, 40)) # np.linspace 等差数列 print("计算的区间:", section, len(section)) print("计算的频数:", freq, len(freq)) ## Using stepMode="center" causes the plot to draw two lines for each sample. ## notice that len(x) == len(y)+1 plt1.plot(section, freq, stepMode="center", fillLevel=0, fillOutline=True, brush=(100, 50, 255, 150)) # x, y # stepMode 步进模式 # fillLevel # fillOutline 填充轮廓线 # brush(r, g, b, a) 填充颜色 a为不透明度 # 散点图 y = pg.pseudoScatter(vals, spacing=0.15) # spacing 点之间的距离 print("xxx:", y, len(y)) # plt2.plot(vals, y, pen=None, symbol='o', symbolSize=5) plt2.plot(vals, y, pen=None, symbol='o', symbolSize=5, symbolPen=(0, 0, 0, 200), symbolBrush=(150, 100, 185, 150)) # symbol 点形状 # symbolSize 点大小 # symbolPen 点边缘线 颜色 # symbolBrush 点的填充颜色 window.show() # 消息循环 exit_code = app.exec_() print("退出的状态码:", exit_code) sys.exit(exit_code)- 1
- 2
- 3
- 4
- 5
- 6
- 7
- 8
- 9
- 10
- 11
- 12
- 13
- 14
- 15
- 16
- 17
- 18
- 19
- 20
- 21
- 22
- 23
- 24
- 25
- 26
- 27
- 28
- 29
- 30
- 31
- 32
- 33
- 34
- 35
- 36
- 37
- 38
- 39
- 40
- 41
- 42
- 43
- 44
- 45
- 46
- 47
- 48
- 49
- 50
- 51
- 52
- 53
- 54
- 55
- 56
- 57
- 58
- 59
- 60
- 61
- 62
- 63
- 64
- 65
- 66
- 67
- 68
- 69
- 70
- 71
- 72
- 73
- 74
- 75
- 76
- 77
- 78
- 79
- 80
- 81
- 82
- 83
使用pyqtgraph总结
- 交互模式(ipython)
快速展示数据
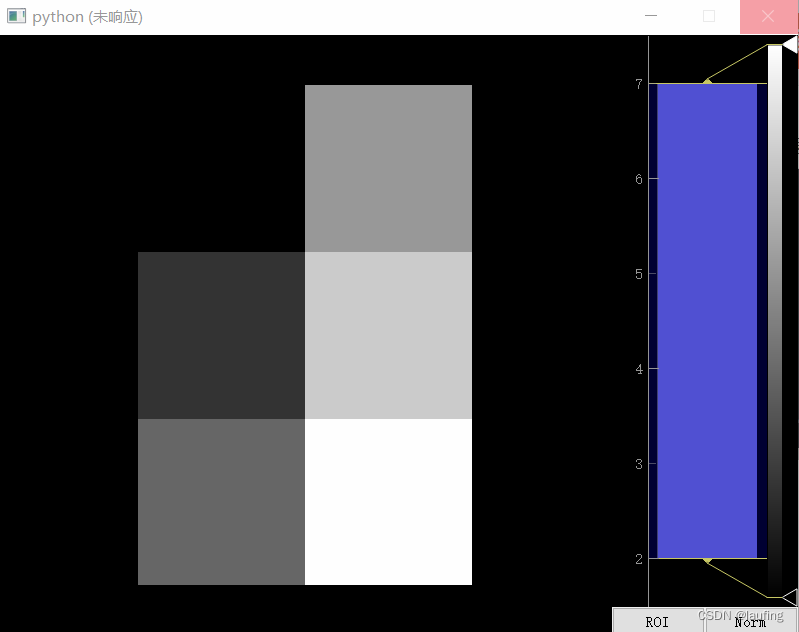
import pyqtgraph as pg # 1 plot画图 # pg.plot(data) # data list or ndarray (n, ) (n, 2) # plot x vs y in red line, return PlotWidget obj pw = pg.plot(xVals, yVals, pen='r') # 继续绘制数据 pw.plot(xVals, yVals2, pen='b') pw.setTitle("标题", color="cyan") pw.setBackground((x,x,x,x)) # RGBW # 展示 pg.exec() # 2 图形布局 win = pg.GraphicsLayoutWidget(parent) # Automatically generates grids with multiple items plot1 = win.addPlot(data1, row=0, col=0) # 不指定row/col时,默认在一行 win.nextRow() 换行 plot2 = win.addPlot(data2, row=0, col=1) plot3 = win.addPlot(data3, row=1, col=0, colspan=2) # 展示 pg.exec() # 图3 import numpy as np data = np.array([2,1,4,5,4,3]).reshape(2,3) pg.show(data) # data must be a numpy array with 2 to 4 dims # 最后展示 pg.exec()- 1
- 2
- 3
- 4
- 5
- 6
- 7
- 8
- 9
- 10
- 11
- 12
- 13
- 14
- 15
- 16
- 17
- 18
- 19
- 20
- 21
- 22
- 23
- 24
- 25
- 26
- 27
- 28
图3
-
应用弹窗绘图
应用程序中数据状态的即时反馈 -
嵌入到pyqt 控件,如pyside2/pyqt5
如果两个库都有安装,先导入哪个库,pyqtgraph就用哪个。
## this will force pyqtgraph to use PySide2 instead of PyQt5 import PySide2 import pyqtgraph as pg- 1
- 2
- 3
- 4
PlotWidget, ImageView, GraphicsLayoutWidget, and GraphicsView.
pyqtgraph 画图方式
基本参数
x - x轴数据,可选,未指定时自动生成
y - y轴数据
pen - 指定pen=‘r’ …绘制线;None 不绘制线
symbol - 可选,点形状 如"o"/“s” ; 也可指定每个点的形状[“o”, “s”, “o”]
symbolPen - 点的边缘线颜色 ‘r’
symbolBrush - 点的填充色 (r, g, b, a)
fillLevel - 填充线下区域 1
brush - 填充线下区域的颜色(r, g, b, a)
绘图方法
- 绘制一个图形窗口
pyqtgraph.plot(*args, **kargs), 一般用于交互模式
# 导包 from PySide2.QtWidgets import QApplication import pyqtgraph as pg if __name__ == '__main__': import sys app = QApplication(sys.argv) # 单独绘制图形,形成一个主窗口 # 创建并返回一个PlotWidget 对象 (pyqtgraph.PlotWidget) plotWidget = pg.plot(title="title666") # title 为窗口标题 # 设置宽高 plotWidget.resize(400, 400) # 绘制图形 plotWidget.plot([1,2,3], [3,4,5], pen='r') # plotWidget.setBackground() # 循环画图 # for i in range(3) # plotWidget.plot(x, y[i], pen=(i, 3)) # 自动生成三种颜色 # 消息循环 sys.exit(app.exec_())- 1
- 2
- 3
- 4
- 5
- 6
- 7
- 8
- 9
- 10
- 11
- 12
- 13
- 14
- 15
- 16
- 17
- 18
- 19
- 20
- 21
- 22
- 23
- 24
2. 嵌入pyqt控件中,使用PlotWidget/ GraphicsLayoutWidget
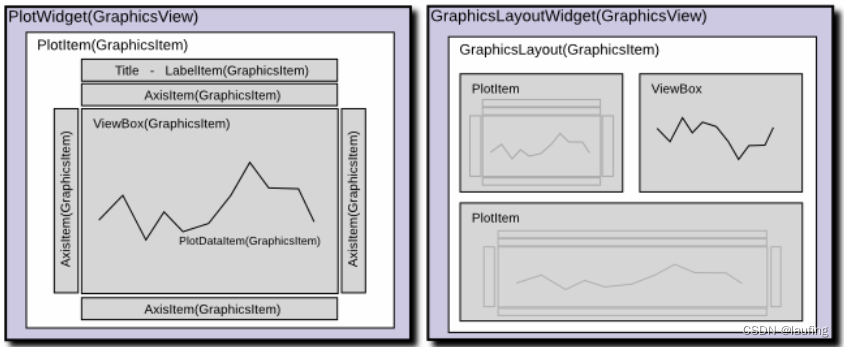
单个图形:from PySide2.QtWidgets import QApplication, QWidget import pyqtgraph as pg if __name__ == '__main__': import sys app = QApplication(sys.argv) window = QWidget() window.resize(800, 600) window.setWindowTitle("图形嵌入控件") # 创建并返回一个PlotWidget 对象 (pyqtgraph.PlotWidget) plotWidget = pg.PlotWidget(window) plotWidget.resize(400, 400) plotWidget.move(100, 100) # 绘制图形 # pen 画线图 "r"/(i, 3)自动生成三种颜色/QPen() # fillLevel 填充线下区域 开始的y值 # fillBrush 填充的颜色 plotWidget.plot([1,2,3], [3,4,5], pen='r', fillLevel=2, fillBrush=(100, 200, 150, 100)) # 画图项 plotItem = plotWidget.getPlotItem() print("plot item:", plotItem) print("函数:", dir(plotItem)) # 设置标题 plotWidget.setTitle("标题") plotWidget.setBackground("w") plotWidget.setLabel("left", 'y轴', units="cm", **style) # 轴的标题 plotWidget.setXRange(0, 5, spacing=0.5) # 轴的范围 plotWidget.setLogMode(x=True, y=False) # 设置x轴 等比数列 plotWidget.addLegend() # 增加图例 plotWidget.showGrid(x=True, y=True) plotWidget.enableAutoRange('xy', True) # 坐标轴的值范围 会根据图形自动变化, False 则不变 # 坐标轴的显示与隐藏 plotWidget.showAxis("bottom", False) # plotWidget底层是PlotItem window.show() sys.exit(app.exec_())- 1
- 2
- 3
- 4
- 5
- 6
- 7
- 8
- 9
- 10
- 11
- 12
- 13
- 14
- 15
- 16
- 17
- 18
- 19
- 20
- 21
- 22
- 23
- 24
- 25
- 26
- 27
- 28
- 29
- 30
- 31
- 32
- 33
- 34
- 35
- 36
- 37
- 38
- 39
- 40
- 41
- 42
多个图形:
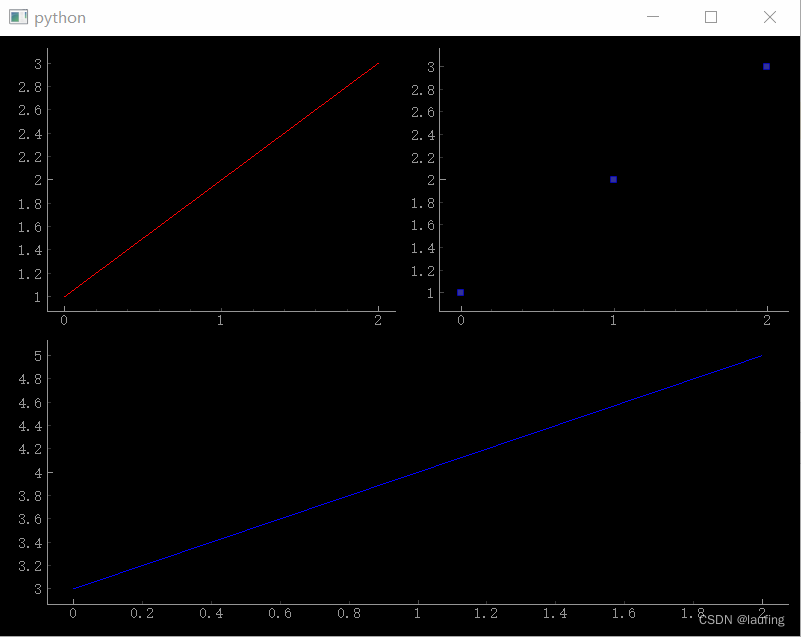
from PySide2.QtWidgets import QApplication, QWidget, QLabel, QPushButton from PySide2.QtGui import QIcon, QPicture, QPixmap import pyqtgraph as pg import numpy as np if __name__ == '__main__': import sys app = QApplication(sys.argv) window = QWidget() window.resize(800, 600) # 多个图形 gl = pg.GraphicsLayoutWidget(window) gl.resize(800, 600) # 添加图形 plot1 = gl.addPlot(row=0, col=0) plot2 = gl.addPlot(row=0, col=1) plot3 = gl.addPlot(row=1, col=0, colspan=2) # 设置线的样式 颜色、宽度 myPen = pg.mkPen(color=(255, 0, 0), width=20, style=Qt.DashLine) plot1.plot([1,2,3], pen=myPen) plot2.plot([1,2,3], pen=None, symbol="s", symbolSize=6, symbolPen=(0, 0, 254, 150)) plot3.plot([3,4,5], pen="b") window.show() sys.exit(app.exec_())- 1
- 2
- 3
- 4
- 5
- 6
- 7
- 8
- 9
- 10
- 11
- 12
- 13
- 14
- 15
- 16
- 17
- 18
- 19
- 20
- 21
- 22
- 23
- 24
- 25
- 26
- 27
- 28
- 29
- 30
- 31
- 绘制2D、3D图形
pyqtgraph.image(*args, **kargs)
Create and return an ImageView Will show 2D or 3D image data. Accepts a title argument to set the title of the window. All other arguments are used to show data. (see ImageView.setImage()) - 控制台窗口
pyqtgraph.dbg(*args, **kwds)
Create a console window and begin watching for exceptions.
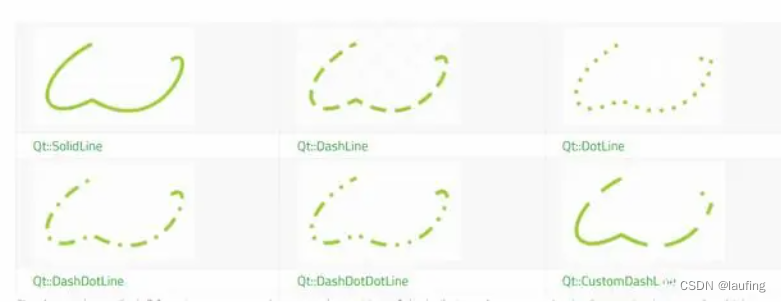
设置线的样式
from PySide2.QtCore import Qt from pyqtgraph import mkPen # 定义自己的pen myPen = mkPen(color=(r, g, b, a), width=16, style=Qt.DashLine)- 1
- 2
- 3
- 4
综合案例
- 设置线的样式
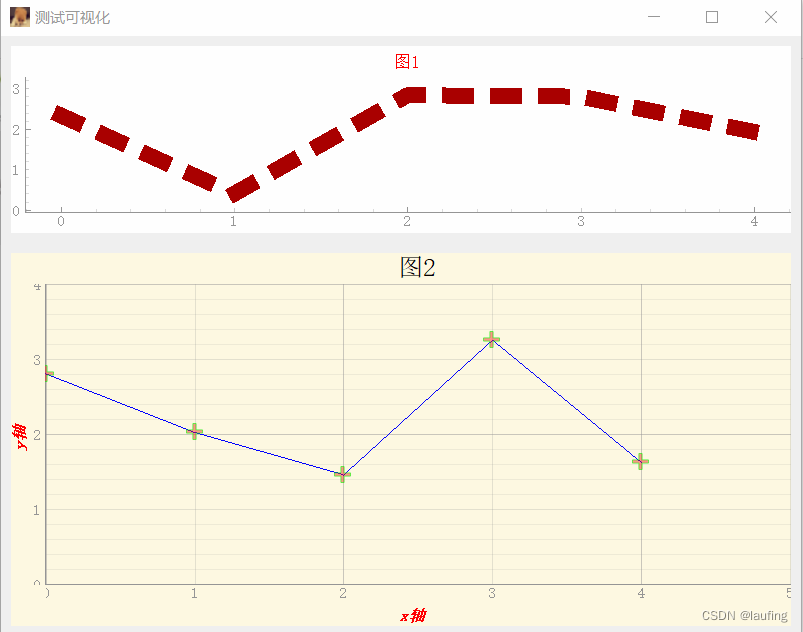
from PySide2.QtWidgets import QWidget, QApplication, QPushButton, QDesktopWidget, QVBoxLayout from PySide2.QtCore import Qt, QTimer, QSize, QDate from PySide2.QtGui import QIcon, QPixmap, QPen, QPicture, QPalette, QPaintEvent, QDesktopServices, QColor import pyqtgraph as pg from pyqtgraph import PlotWidget from pyqtgraph import mkPen # 生成画笔 from pyqtgraph import mkBrush # 生成笔刷 from pyqtgraph import mkColor # 生成颜色对象 class MyWindow(QWidget): def __init__(self, title="laufing"): super(MyWindow, self).__init__() # 窗口的尺寸及居中 self.resize(800, 600) desk = QDesktopWidget().geometry() width, height = desk.width(), desk.height() self.move(width//2 - self.width()//2, height//2 - self.height()//2) # 窗口标题 self.setWindowTitle(title) self.setWindowIcon(QIcon("./imgs/dog.jpg")) # self.setUI() def setUI(self): # 垂直布局 vb = QVBoxLayout() vb.setContentsMargins(10, 10, 10, 10) # 设置内容边距 vb.setSpacing(20) # 子控件间隔 # 实例化 绘图控件 plotWidget1 = PlotWidget() plotWidget2 = PlotWidget() # 绘制数据 import numpy as np # 正态分布采样 均值为2 标准差1 采样数据shape x = np.random.normal(loc=2, scale=1, size=(2, 5)) # 生成自己的画笔 myPen = mkPen(color=(170, 0, 0), width=16, style=Qt.DotLine) # 绘制图形 line1 = plotWidget1.plot(x[0], pen=myPen) # 设置图形标题 plotWidget1.setTitle("图1", color="r", size="10pt") # size为字符串 # 设置背景色 plotWidget1.setBackground("w") # 单个字母表示颜色 line2 = plotWidget2.plot(x[1], pen='b', name="图例legend", symbol="+", symbolSize=16, symbolPen=(0, 255, 0, 150), symbolBrush=(254, 0, 0, 100)) # symbol 添加标记 plotWidget2.setTitle("图2", color="k", size="15pt") # 15px ,也支持富文本html plotWidget2.setBackground((254, 249, 226)) # RGB 表颜色 # plotWidget2.setBackground(QColor(254, 249, 226)) # 设置轴的标题 y_style = { # css键值对 "color": "red", "font-size": "16px", "text-align": "center", "font-family": "宋体", "font-weight": "bold", "font-style": "italic" } plotWidget2.setLabel("left", "y轴", **y_style) # 支持富文本 plotWidget2.setLabel("bottom", "x轴", **y_style) # 为曲线增加图例(?) plotWidget2.addLegend() # 显示网格线 plotWidget2.showGrid(x=True, y=True) # 轴的范围 plotWidget2.setYRange(0, 4, padding=0) plotWidget2.setXRange(0, 5, padding=0) # 清除线条 # plotWidget2.clear() # 更新局部数据 def updateLine(): nonlocal x # 外部函数的局部作用域 print("xxx:", x) # 生成数据 x = np.random.normal(loc=2, scale=1, size=(2, 5)) # 更新图形中的数据 line2.setData(x[1]) self.timer = QTimer(plotWidget2) self.timer.timeout.connect(updateLine) self.timer.start(500) # 0.5s 执行一次 # 布局添加子控件 vb.addWidget(plotWidget1) vb.addWidget(plotWidget2) vb.setStretch(0, 1) # idx, value子控件的伸缩因子 vb.setStretch(1, 2) self.setLayout(vb) if __name__ == '__main__': import sys # 创建应用程序 app = QApplication(sys.argv) win = MyWindow("测试可视化") win.show() # 进入消息循环 sys.exit(app.exec_())- 1
- 2
- 3
- 4
- 5
- 6
- 7
- 8
- 9
- 10
- 11
- 12
- 13
- 14
- 15
- 16
- 17
- 18
- 19
- 20
- 21
- 22
- 23
- 24
- 25
- 26
- 27
- 28
- 29
- 30
- 31
- 32
- 33
- 34
- 35
- 36
- 37
- 38
- 39
- 40
- 41
- 42
- 43
- 44
- 45
- 46
- 47
- 48
- 49
- 50
- 51
- 52
- 53
- 54
- 55
- 56
- 57
- 58
- 59
- 60
- 61
- 62
- 63
- 64
- 65
- 66
- 67
- 68
- 69
- 70
- 71
- 72
- 73
- 74
- 75
- 76
- 77
- 78
- 79
- 80
- 81
- 82
- 83
- 84
- 85
- 86
- 87
- 88
- 89
- 90
- 91
- 92
- 93
- 94
- 95
- 96
- 97
- 98
- 99
- 100
- 101
- 102
- 103
- 104
- 105
- 106
- 107
- 108
- 109
- 110
- 111
- 112
- 113
- 114
- 115
- 设置边界线
拖动左边的边界线,右图的轴范围变化。
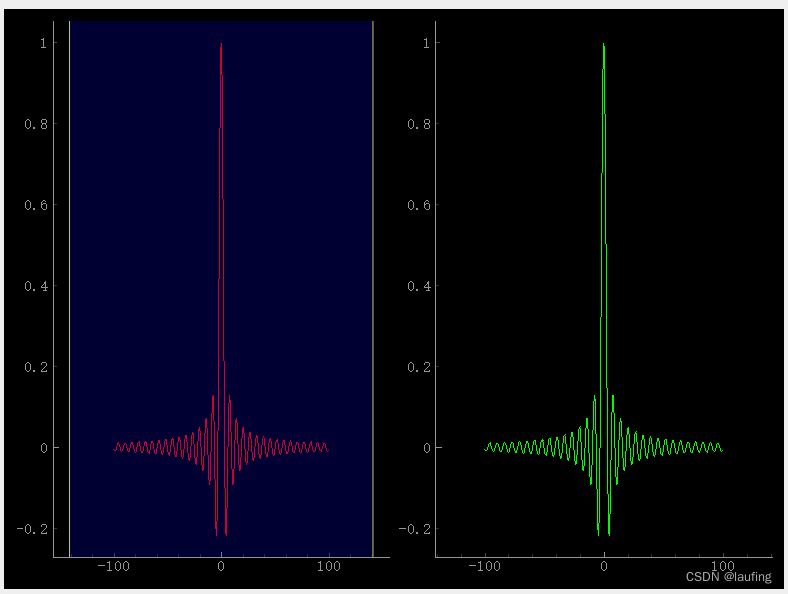
# __author__ = "laufing" # class_based_qt # laufing_qt from PySide2.QtWidgets import QWidget, QApplication, QDesktopWidget, QHBoxLayout, QVBoxLayout from PySide2.QtCore import QTimer from PySide2.QtGui import QIcon, QPixmap, QPicture, QColor, QFont, QKeyEvent, QMouseEvent, QDesktopServices import pyqtgraph as pg from pyqtgraph import mkPen from pyqtgraph import PlotWidget, PlotItem, GraphicsLayoutWidget import numpy as np class MyWindow(QWidget): def __init__(self): super(MyWindow, self).__init__() # desk = QDesktopWidget().geometry() width, height = desk.width(), desk.height() self.resize(800, 600) self.move(width//2 - self.width()//2, height//2 - self.height()//2) self.setWindowTitle("laufing") self.setWindowIcon(QIcon("./imgs/dog.jpg")) # self.setUi() def setUi(self): hb= QHBoxLayout() hb.setContentsMargins(10, 10, 10, 10) hb.setSpacing(6) # 生成数据 x = np.linspace(-100, 100, 1000) y = np.sin(x) / x graphic = GraphicsLayoutWidget(self) # 添加图形, 默认水平排列 plotItem1 = graphic.addPlot() print("plot item:", plotItem1, dir(plotItem1)) plotItem2 = graphic.addPlot() plotItem1.plot(x, y, pen="r") # plotItem1.setTitle("graphic1", color="r") # plotItem1.setBackground("w") 没有该属性 # plotItem1.setLabel("left", "y轴", units="cm", color="blue") # plotItem1.setLabel("bottom", "x轴", units="cm", color="blue") # plotItem1.addLegend() # 无效 # plotItem1.showGrid(x=True, y=True) # 添加边界线 lineItem = pg.LinearRegionItem([-50, 50]) lineItem.setZValue(10) plotItem1.addItem(lineItem) # 添加事件 def updatePlotItem2(): print("xxxx", lineItem.getRegion()) # 第二个图更新 坐标值 plotItem2.setXRange(*lineItem.getRegion(), padding=0) def updatePlotItem1(): # 获取图2的XRange & YRange print("view box:", plotItem2.getViewBox().viewRange()) # 重新设置线的范围 lineItem.setRegion(plotItem2.getViewBox().viewRange()[0]) # 线的区域发生变化 lineItem.sigRegionChanged.connect(updatePlotItem2) # plotItem2 的坐标轴发生变化 plotItem2.sigXRangeChanged.connect(updatePlotItem1) plotItem2.plot(x, y, pen="g") # 布局添加子控件 hb.addWidget(graphic) # 父窗口 添加子控件 self.setLayout(hb) if __name__ == '__main__': import sys app = QApplication(sys.argv) win = MyWindow() win.show() exit_code = app.exec_() sys.exit(exit_code)- 1
- 2
- 3
- 4
- 5
- 6
- 7
- 8
- 9
- 10
- 11
- 12
- 13
- 14
- 15
- 16
- 17
- 18
- 19
- 20
- 21
- 22
- 23
- 24
- 25
- 26
- 27
- 28
- 29
- 30
- 31
- 32
- 33
- 34
- 35
- 36
- 37
- 38
- 39
- 40
- 41
- 42
- 43
- 44
- 45
- 46
- 47
- 48
- 49
- 50
- 51
- 52
- 53
- 54
- 55
- 56
- 57
- 58
- 59
- 60
- 61
- 62
- 63
- 64
- 65
- 66
- 67
- 68
- 69
- 70
- 71
- 72
- 73
- 74
- 75
- 76
- 77
- 78
- 79
- 80
- 81
- 82
- 83
- 84
- 85
- 86
- 87
- 88
- 89
- 90
- 91
- 92
;
3. 在上图的基础上,实现增加一个频率直方图
写好的窗口,直接作为一个子窗口
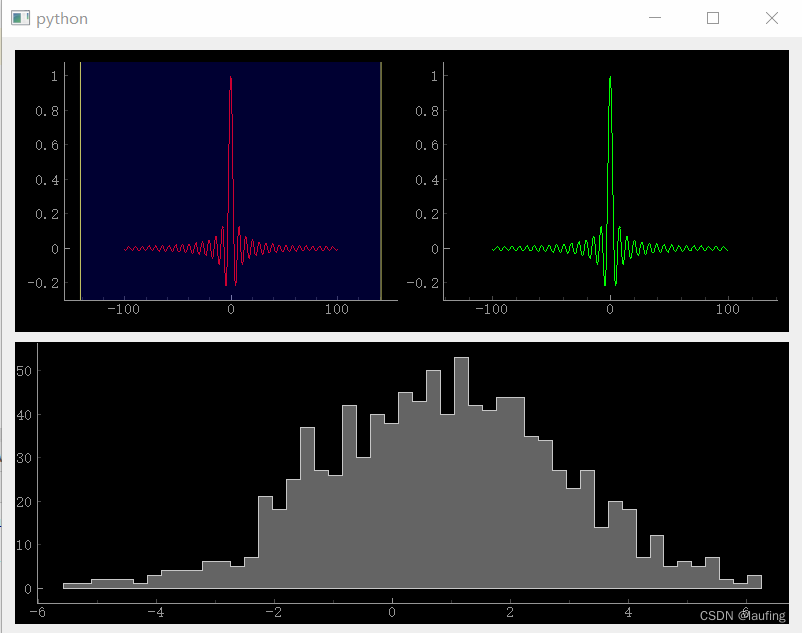
# __author__ = "laufing" # class_based_qt # laufing_qt from PySide2.QtWidgets import QApplication, QWidget, QPushButton, QLabel, QHBoxLayout, QVBoxLayout from PySide2.QtCore import QTimer from PySide2.QtGui import QIcon, QFont, QColor import pyqtgraph as pg from pyqtgraph import GraphicsLayoutWidget, PlotWidget from pyqtgraph_7 import MyWindow class PWin(QWidget): def __init__(self): super(PWin, self).__init__() self.resize(800, 600) self.move(200, 200) self.setUI() def setUI(self): # 实例化布局对象 vb = QVBoxLayout() # 第一个子控件,写好的子窗口 myWin = MyWindow() # 第二个子控件 pw = PlotWidget() # 生成数据 import numpy as np x = np.random.normal(loc=1, scale=2, size=1000) freq, section = np.histogram(x, bins=50) pw.plot(section, freq, stepMode="center", fillLevel=0, fillBrush=(100, 100, 100), fillOutline="r") # 布局添加子控件 vb.addWidget(myWin) vb.addWidget(pw) vb.setSpacing(10) vb.setStretch(0, 1) vb.setStretch(1, 1) # 父窗口 设置垂直布局 self.setLayout(vb) if __name__ == '__main__': import sys app = QApplication(sys.argv) pwin = PWin() pwin.show() exit_code = app.exec_() sys.exit(exit_code)- 1
- 2
- 3
- 4
- 5
- 6
- 7
- 8
- 9
- 10
- 11
- 12
- 13
- 14
- 15
- 16
- 17
- 18
- 19
- 20
- 21
- 22
- 23
- 24
- 25
- 26
- 27
- 28
- 29
- 30
- 31
- 32
- 33
- 34
- 35
- 36
- 37
- 38
- 39
- 40
- 41
- 42
- 43
- 44
- 45
- 46
- 47
- 48
- 49
- 50
- 51
- 52
- 53
- 54
4. 在已写好的窗口上,扩展功能
一个Qt designer 界面就是一个类, 类名为Ui_创建对象名
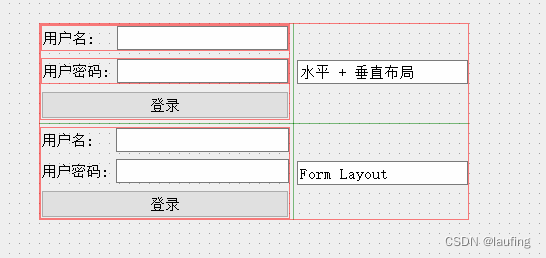
from PySide2.QtCore import * from PySide2.QtGui import * from PySide2.QtWidgets import * import logging logging.basicConfig(level=logging.DEBUG, format="%(asctime)s %(message)s") class Ui_Lauf(object): def setupUi(self, Lauf): # Lauf 为父控件 if not Lauf.objectName(): Lauf.setObjectName(u"Lauf") # 重置父控件的宽高 Lauf.resize(1086, 692) # 创建一个空白窗口,放入父控件 self.widget = QWidget(Lauf) self.widget.setObjectName(u"widget") self.widget.setGeometry(QRect(150, 70, 430, 197)) # 在空白窗口中,实例化网格布局 self.gridLayout = QGridLayout(self.widget) self.gridLayout.setObjectName(u"gridLayout") self.gridLayout.setContentsMargins(0, 0, 0, 0) # 垂直布局 self.verticalLayout = QVBoxLayout() self.verticalLayout.setObjectName(u"verticalLayout") self.horizontalLayout = QHBoxLayout() self.horizontalLayout.setObjectName(u"horizontalLayout") # self.label = QLabel(self.widget) self.label.setObjectName(u"label") self.horizontalLayout.addWidget(self.label) self.lineEdit = QLineEdit(self.widget) self.lineEdit.setObjectName(u"lineEdit") # 尺寸策略 sizePolicy = QSizePolicy(QSizePolicy.Fixed, QSizePolicy.Fixed) sizePolicy.setHorizontalStretch(0) sizePolicy.setVerticalStretch(0) logging.debug(self.lineEdit.sizePolicy().hasHeightForWidth()) # 设置宽高比 sizePolicy.setHeightForWidth(self.lineEdit.sizePolicy().hasHeightForWidth()) # 设置尺寸策略 self.lineEdit.setSizePolicy(sizePolicy) self.horizontalLayout.addWidget(self.lineEdit) self.verticalLayout.addLayout(self.horizontalLayout) self.horizontalLayout_2 = QHBoxLayout() self.horizontalLayout_2.setObjectName(u"horizontalLayout_2") self.label_2 = QLabel(self.widget) self.label_2.setObjectName(u"label_2") self.horizontalLayout_2.addWidget(self.label_2) self.lineEdit_2 = QLineEdit(self.widget) self.lineEdit_2.setObjectName(u"lineEdit_2") sizePolicy.setHeightForWidth(self.lineEdit_2.sizePolicy().hasHeightForWidth()) self.lineEdit_2.setSizePolicy(sizePolicy) self.horizontalLayout_2.addWidget(self.lineEdit_2) self.verticalLayout.addLayout(self.horizontalLayout_2) self.pushButton = QPushButton(self.widget) self.pushButton.setObjectName(u"pushButton") self.verticalLayout.addWidget(self.pushButton) # 网格布局 row, col, rowSpan, colSpan self.gridLayout.addLayout(self.verticalLayout, 0, 0, 1, 1) self.lineEdit_5 = QLineEdit(self.widget) self.lineEdit_5.setObjectName(u"lineEdit_5") self.gridLayout.addWidget(self.lineEdit_5, 0, 1, 1, 1) self.formLayout = QFormLayout() self.formLayout.setObjectName(u"formLayout") self.label_3 = QLabel(self.widget) self.label_3.setObjectName(u"label_3") # self.formLayout.addRow() # 设置第0行的Label Field self.formLayout.setWidget(0, QFormLayout.LabelRole, self.label_3) self.lineEdit_3 = QLineEdit(self.widget) self.lineEdit_3.setObjectName(u"lineEdit_3") self.formLayout.setWidget(0, QFormLayout.FieldRole, self.lineEdit_3) self.label_4 = QLabel(self.widget) self.label_4.setObjectName(u"label_4") self.formLayout.setWidget(1, QFormLayout.LabelRole, self.label_4) self.lineEdit_4 = QLineEdit(self.widget) self.lineEdit_4.setObjectName(u"lineEdit_4") self.formLayout.setWidget(1, QFormLayout.FieldRole, self.lineEdit_4) self.pushButton_2 = QPushButton(self.widget) self.pushButton_2.setObjectName(u"pushButton_2") self.formLayout.setWidget(2, QFormLayout.SpanningRole, self.pushButton_2) self.gridLayout.addLayout(self.formLayout, 1, 0, 1, 1) self.lineEdit_6 = QLineEdit(self.widget) self.lineEdit_6.setObjectName(u"lineEdit_6") self.gridLayout.addWidget(self.lineEdit_6, 1, 1, 1, 1) # 自定义方法, 设置标题 self.retranslateUi(Lauf) QMetaObject.connectSlotsByName(Lauf) # setupUi def retranslateUi(self, Lauf): # 设置标题 Lauf.setWindowTitle(QCoreApplication.translate("Lauf", u"Form", None)) self.label.setText(QCoreApplication.translate("Lauf", u"\u7528\u6237\u540d:", None)) self.label_2.setText(QCoreApplication.translate("Lauf", u"\u7528\u6237\u5bc6\u7801:", None)) self.pushButton.setText(QCoreApplication.translate("Lauf", u"\u767b\u5f55", None)) self.lineEdit_5.setText(QCoreApplication.translate("Lauf", u"\u6c34\u5e73 + \u5782\u76f4\u5e03\u5c40", None)) self.label_3.setText(QCoreApplication.translate("Lauf", u"\u7528\u6237\u540d:", None)) self.label_4.setText(QCoreApplication.translate("Lauf", u"\u7528\u6237\u5bc6\u7801:", None)) self.pushButton_2.setText(QCoreApplication.translate("Lauf", u"\u767b\u5f55", None)) self.lineEdit_6.setText(QCoreApplication.translate("Lauf", u"Form Layout", None)) # retranslateUi if __name__ == '__main__': import sys app = QApplication(sys.argv) # 一个Qt designer 界面就是一个类 win = QWidget() # 实例化Qt designer 设计的窗口 u = Ui_Lauf() # 展示在父控件中 u.setupUi(win) win.show() sys.exit(app.exec_())- 1
- 2
- 3
- 4
- 5
- 6
- 7
- 8
- 9
- 10
- 11
- 12
- 13
- 14
- 15
- 16
- 17
- 18
- 19
- 20
- 21
- 22
- 23
- 24
- 25
- 26
- 27
- 28
- 29
- 30
- 31
- 32
- 33
- 34
- 35
- 36
- 37
- 38
- 39
- 40
- 41
- 42
- 43
- 44
- 45
- 46
- 47
- 48
- 49
- 50
- 51
- 52
- 53
- 54
- 55
- 56
- 57
- 58
- 59
- 60
- 61
- 62
- 63
- 64
- 65
- 66
- 67
- 68
- 69
- 70
- 71
- 72
- 73
- 74
- 75
- 76
- 77
- 78
- 79
- 80
- 81
- 82
- 83
- 84
- 85
- 86
- 87
- 88
- 89
- 90
- 91
- 92
- 93
- 94
- 95
- 96
- 97
- 98
- 99
- 100
- 101
- 102
- 103
- 104
- 105
- 106
- 107
- 108
- 109
- 110
- 111
- 112
- 113
- 114
- 115
- 116
- 117
- 118
- 119
- 120
- 121
- 122
- 123
- 124
- 125
- 126
- 127
- 128
- 129
- 130
- 131
- 132
- 133
- 134
- 135
- 136
- 137
- 138
- 139
- 140
- 141
- 142
- 143
- 144
- 145
- 146
- 147
- 148
- 149
- 150
- 151
- 152
- 153
- 154
绘制多个图形,并网格布局
- 绘制九个图形,并实现网格布局;
- 九个图形共享x、y坐标轴;
- 九个图形中相同颜色的曲线共享同一个图例;
效果如下:
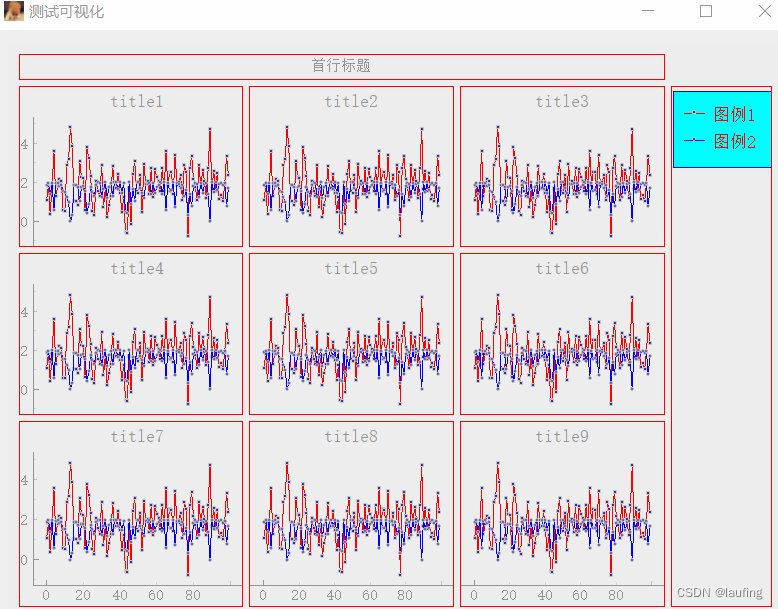
代码:
# __author__ = "laufing" # class_based_qt # laufing_qt import numpy as np import logging logging.basicConfig(level=logging.DEBUG, format="%(asctime)s %(levelname)s %(message)s") from PySide2.QtWidgets import QWidget, QApplication, QPushButton, QDesktopWidget, QVBoxLayout from PySide2.QtCore import Qt, QTimer, QSize, QDate from PySide2.QtGui import QIcon, QPixmap, QPen, QPicture, QPalette, QPaintEvent, QDesktopServices import pyqtgraph as pg class MyItemSample(pg.ItemSample): """ 自定义图例项目子类 """ pen = None items = None instance = None def __new__(cls, item): """ item: PlotDataItem """ item_pen = item.opts.get("pen") if item_pen == cls.pen: cls.items.append(item) return cls.instance cls.pen = item_pen cls.instance = pg.ItemSample.__new__(cls) cls.items = [] cls.items.append(item) return cls.instance def __init__(self, item): # 对象具有自己的items self.items = self.__class__.items if len(self.items) > 1: return else: pg.ItemSample.__init__(self, item) def mouseClickEvent(self, event): if event.button() == Qt.MouseButton.LeftButton: for i in self.items: i.setVisible(not i.isVisible()) event.accept() self.update() class MyLegendItem(pg.LegendItem): """ 自定义图例 子类 """ pen = None name = None def addItem(self, item, name): """ 重写 """ self.sampleType = MyItemSample label = pg.LabelItem(name, color=self.opts['labelTextColor'], justify='left', size=self.opts['labelTextSize']) if isinstance(item, self.sampleType): sample = item else: sample = self.sampleType(item) self.items.append((sample, label)) if item.opts.get("pen") != self.pen and name != self.name: self.pen = item.opts.get("pen") self.name = name elif item.opts.get("pen") == self.pen and name == self.name: return else: raise ValueError("同一类曲线图例名称必须相同") self._addItemToLayout(sample, label) self.updateSize() class MyWindow(QWidget): def __init__(self, title="laufing"): super(MyWindow, self).__init__() # 窗口的尺寸及居中 self.resize(800, 600) desk = QDesktopWidget().geometry() width, height = desk.width(), desk.height() self.move(width//2 - self.width()//2, height//2 - self.height()//2) # 窗口标题 self.setWindowTitle(title) self.setWindowIcon(QIcon("./imgs/dog.jpg")) # self.setUI() def setUI(self): data = np.random.normal(loc=2, scale=1, size=100) # 垂直布局 vb = QVBoxLayout(self) graphic_view = pg.GraphicsView() graphic_view.setBackground("#eee") vb.addWidget(graphic_view) # layout 布局 graphic_layout = pg.GraphicsLayout(border=(255, 0, 0)) graphic_view.setCentralWidget(graphic_layout) # 添加一个标题 label = graphic_layout.addLabel("首行标题", colspan=3) graphic_layout.nextRow() # 生成九个图形 plot_items = [] plot_data_items = [] for i in range(9): if i == 3: legend_layout = graphic_layout.addLayout(rowspan=3) legend_layout.setFixedWidth(100) legend_item = MyLegendItem(size=(10, 10), offset=(0, 5)) legend_item.setParentItem(legend_layout) # 图例边框色 legend_item.setPen("b") # 填充色 legend_item.setBrush("cyan") legend_item.setLabelTextColor("r") legend_item.setLabelTextSize("10pt") if i % 3 == 0 and i != 0: graphic_layout.nextRow() plot_item = graphic_layout.addPlot(title=f"title{i+1}") plot_items.append(plot_item) r_line = plot_item.plot(data, pen="r", symbol="s", symbolSize=3) b_line = plot_item.plot(np.sin(data) + 1, pen="b", symbol="o", symbolSize=3) plot_data_items.extend([r_line, b_line]) # 隐藏坐标轴 if i % 3 != 0: # 隐藏y轴 plot_item.hideAxis("left") plot_item.hideButtons() if i / 6 < 1: # 隐藏x轴 plot_item.hideAxis("bottom") plot_item.hideButtons() # 关联图形 for i in range(len(plot_items) - 1): plot_items[i].setXLink(plot_items[i+1]) plot_items[i].setYLink(plot_items[i+1]) # 共享坐标轴后尺寸不一致问题 graphic_layout.layout.setColumnStretchFactor(0, 100) graphic_layout.layout.setColumnStretchFactor(1, 90) graphic_layout.layout.setColumnStretchFactor(2, 90) graphic_layout.layout.setRowStretchFactor(1, 85) graphic_layout.layout.setRowStretchFactor(2, 85) graphic_layout.layout.setRowStretchFactor(3, 100) # 添加图例 for i in range(0, len(plot_data_items), 2): legend_item.addItem(plot_data_items[i], "图例1") for i in range(1, len(plot_data_items), 2): legend_item.addItem(plot_data_items[i], "图例2") if __name__ == '__main__': import sys # 创建应用程序 app = QApplication(sys.argv) win = MyWindow("测试可视化") win.show() # 进入消息循环 sys.exit(app.exec_())- 1
- 2
- 3
- 4
- 5
- 6
- 7
- 8
- 9
- 10
- 11
- 12
- 13
- 14
- 15
- 16
- 17
- 18
- 19
- 20
- 21
- 22
- 23
- 24
- 25
- 26
- 27
- 28
- 29
- 30
- 31
- 32
- 33
- 34
- 35
- 36
- 37
- 38
- 39
- 40
- 41
- 42
- 43
- 44
- 45
- 46
- 47
- 48
- 49
- 50
- 51
- 52
- 53
- 54
- 55
- 56
- 57
- 58
- 59
- 60
- 61
- 62
- 63
- 64
- 65
- 66
- 67
- 68
- 69
- 70
- 71
- 72
- 73
- 74
- 75
- 76
- 77
- 78
- 79
- 80
- 81
- 82
- 83
- 84
- 85
- 86
- 87
- 88
- 89
- 90
- 91
- 92
- 93
- 94
- 95
- 96
- 97
- 98
- 99
- 100
- 101
- 102
- 103
- 104
- 105
- 106
- 107
- 108
- 109
- 110
- 111
- 112
- 113
- 114
- 115
- 116
- 117
- 118
- 119
- 120
- 121
- 122
- 123
- 124
- 125
- 126
- 127
- 128
- 129
- 130
- 131
- 132
- 133
- 134
- 135
- 136
- 137
- 138
- 139
- 140
- 141
- 142
- 143
- 144
- 145
- 146
- 147
- 148
- 149
- 150
- 151
- 152
- 153
- 154
- 155
- 156
- 157
- 158
- 159
- 160
- 161
- 162
- 163
- 164
- 165
- 166
- 167
- 168
- 169
- 170
- 171
- 172
- 173
- 174
- 175
- 176
- 177
-
相关阅读:
30天Python入门(第二十七天:深入了解Python MongoDB)
代码随想录训练营第24天|回溯算法理论基础、LeetCode 77.组合
Docker 的 镜像的常用命令
git:亲测体验rebase与merge
一点思考|关于「引领性研究」的一点感悟
你的程序员女孩「GitHub 热点速览 v.22.09」
在VMD上可视化hdf5格式的分子轨迹文件
LeetCode每日一题(502. IPO)
积水监测系统——方便、快速、及时、多测点同时监测
【尚硅谷 Vue学习笔记】p31列表过滤 p32列表排序
- 原文地址:https://blog.csdn.net/weixin_45228198/article/details/128140662
