-
[PMLR 2017] On calibration of modern neural networks
Introduction
- 在实际的决策系统中,分类模型不仅需要尽量给出准确的预测,还需要能告诉我们它给出的预测有多大可能是错误的。例如在自动驾驶系统中,如果模型识别到障碍物的置信度不高,那么就应该切换到别的传感器做进一步决策。又或者在医疗系统中,当自动诊疗系统置信度不高时,应该进一步求助专业医生。上面描述的性质就要求模型除了预测结果,还需要提供 calibrated confidence measure,也就是说,类别标签对应的预测概率值应该反映它实际预测正确的概率 (ground truth correctness likelihood). 另外,这一性质也使得模型更加具备可解释性,也方便将模型进一步集成到其他概率模型中
- 然而作者发现,modern neural networks are no longer well-calibrated (In general, logistic regression binary classification models and naive Bayes models are often quite well-calibrated. Support vector machine models, random forest decision tree models, and neural network models are often less well-calibrated.). 从 confidence histogram (i.e. distribution of prediction confidence) 可以看出,LeNet 的 average confidence 和真实的 accuracy 十分接近,而 ResNet 的 average confidence 却明显高于真实的 accuracy. 另外从 reliability diagram (which show accuracy as a function of confidence) 也可以更明显地看出 ResNet 并不是 well-calibrated (e.g. 所有预测置信度在 0.9 的样本对应的实际预测正确率也应该在 0.9,但 ResNet 的实际正确率却更低,说明模型存在 over-confident 现象)。理想情况下,模型 reliability diagram 的值应该接近对角线
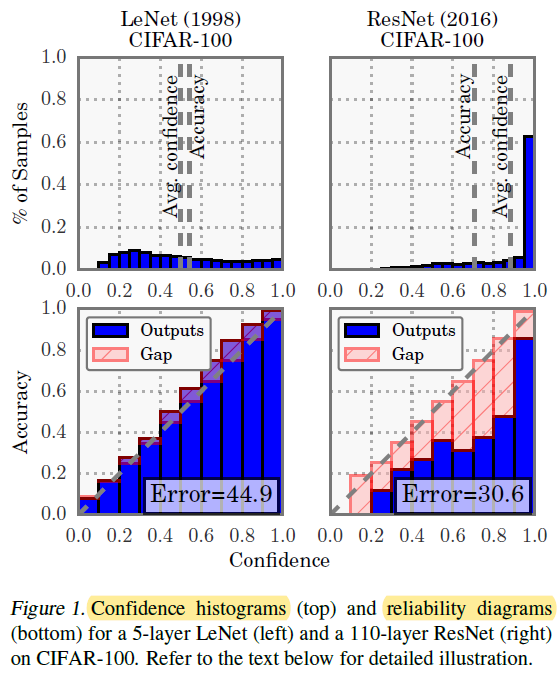
- 通过大量的实验,作者详细分析了神经网络 miscalibrated 的原因,包括 depth, width, weight decay, and Batch Normalization,并探索了缓解这一问题的方法 (i.e. temperature scaling)
Calibration Metrics
- Perfect Calibration
 其中,
h
(
X
)
=
(
Y
^
,
P
^
)
h(X)=(\hat Y,\hat P)
h(X)=(Y^,P^),
h
h
h 为模型,
Y
^
\hat Y
Y^ 为 class prediction,
P
^
\hat P
P^ 为 associated confidence,
Y
Y
Y 为 GT class
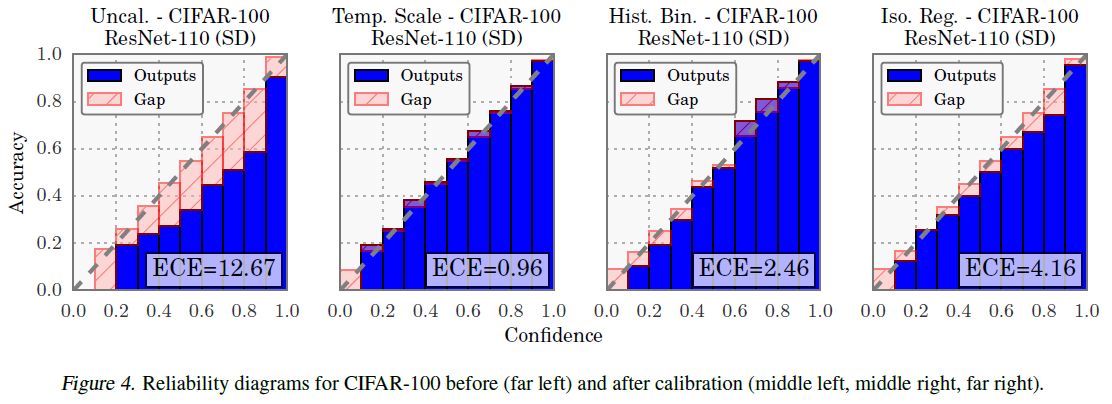
 - Reliability Diagrams. These diagrams plot expected sample accuracy as a function of confidence. If the model is perfectly calibrated, then the diagram should plot the identity function. To estimate the expected accuracy from finite samples, we group predictions into
M
M
M interval bins (each of size
1
/
M
1/M
1/M) and calculate the accuracy of each bin. Let
B
m
B_m
Bm be the set of indices of samples whose prediction confidence falls into the interval
I
m
=
(
m
−
1
M
,
m
M
)
I_m = (\frac{m−1}{M},\frac{m}{M})
Im=(Mm−1,Mm). The accuracy of
B
m
B_m
Bm is
 We define the average confidence within bin
B
m
B_m
Bm as
 这样,
acc
(
B
m
)
\text{acc}(B_m)
acc(Bm) 和
conf
(
B
m
)
\text{conf}(B_m)
conf(Bm) 就分别是对 (1) 式等号左右的估计值,perfectly calibrated model 会满足
acc
(
B
m
)
=
conf
(
B
m
)
\text{acc}(B_m)=\text{conf}(B_m)
acc(Bm)=conf(Bm)

- Expected Calibration Error (ECE). miscalibration 可以用 confidence 和 accuracy 误差绝对值的期望来衡量
 Expected Calibration Error (ECE) 通过离散化来近似计算上式 (similar to the reliability diagrams)
 其中
n
n
n 为样本数。下面给出两个示例,分别计算二分类和多分类的 ECE (pp 代表 output pseudo-probability)
- 二分类
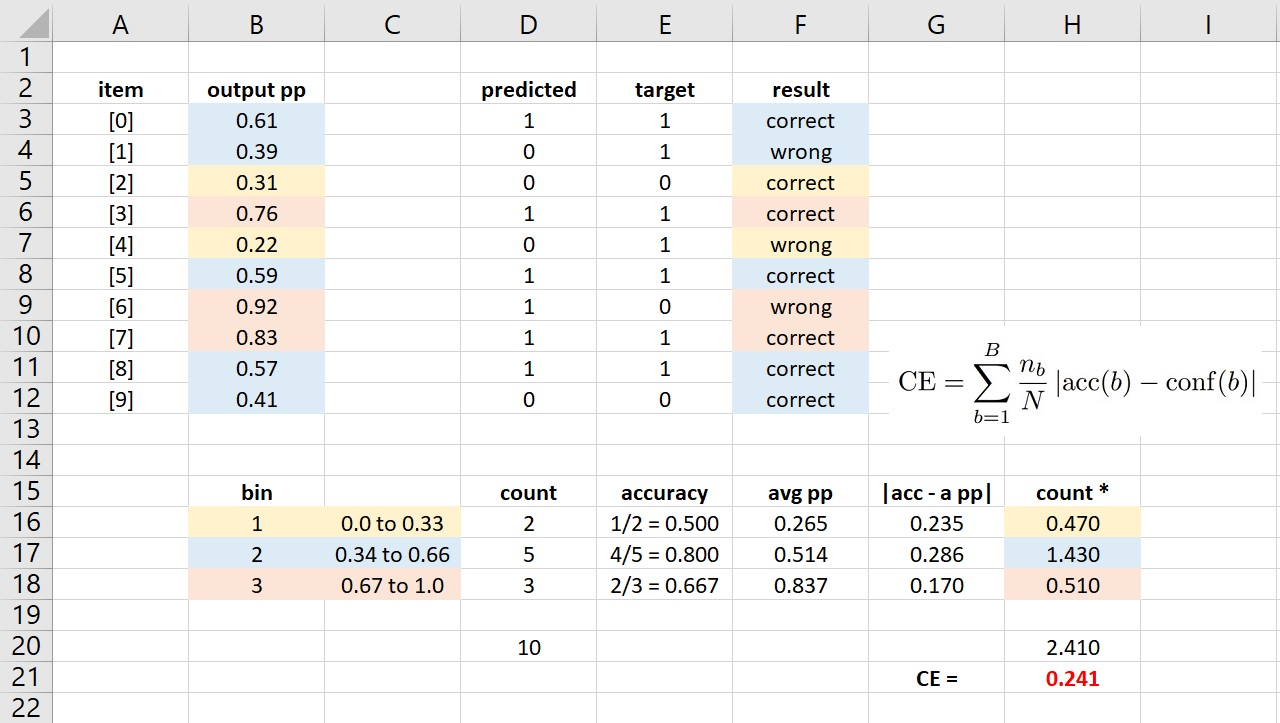
- 多分类 (4 分类):多分类在计算 ECE 时并不需要把每个样本输出的
K
K
K 个 预测概率值都算进去,而是只取最大的概率值即可

- Three disadvantages of ECE are: (1) The number of bins is arbitrary. (2) Equal-interval bins can be skewed with regards to data item counts. (3) By using just the largest output pseudo-probability, some information is being lost
- 二分类
- Maximum Calibration Error (MCE). In high-risk applications where reliable confidence measures are absolutely necessary, we may wish to minimize the worst-case deviation between confidence and accuracy
 Maximum Calibration Error (MCE) 即为对上式的离散化近似

- Negative log likelihood (NLL). 只有当
π
^
(
Y
∣
X
)
\hat\pi(Y|X)
π^(Y∣X) 完美还原 ground truth conditional distribution
π
(
Y
∣
X
)
\pi(Y|X)
π(Y∣X) 时,NLL 才会达到最小值,因此可以用来间接地衡量 model calibration (当 NLL 比较大时,模型对正确类别的输出概率并不高,相反这也就意味着错误类别的输出概率比较高,也对应着错误类别输出 over-confident,进而导致模型 miscalibration)

Observing Miscalibration
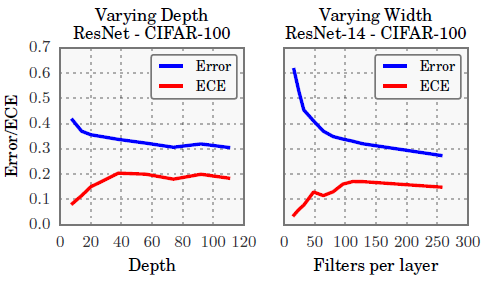
下面作者探讨了一些导致 miscalibration 的原因 (model capacity and lack of regularization are closely related to model (mis)calibration)
- Model capacity (模型规模). During training, after the model is able to correctly classify (almost) all training samples, NLL (Negative Log Likelihood) can be further minimized by increasing the confidence of predictions. Increased model capacity will lower training NLL, and thus the model will be more (over)confident on average.
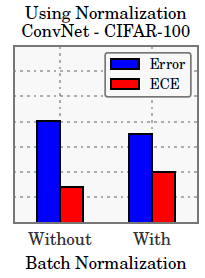
- Batch Normalization. Models trained with Batch Normalization tend to be more miscalibrated. We find that this result holds regardless of the hyperparameters used on the Batch Normalization model (i.e. low or high learning rate, etc.) (这里作者没有给出具体解释,只是进行了实验验证)
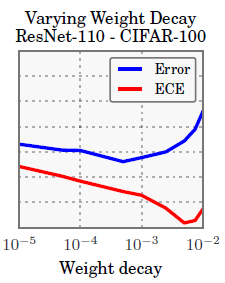
- Weight decay. We find that training with less weight decay has a negative impact on calibration. Model calibration continues to improve when more regularization is added, well after the point of achieving optimal accuracy.
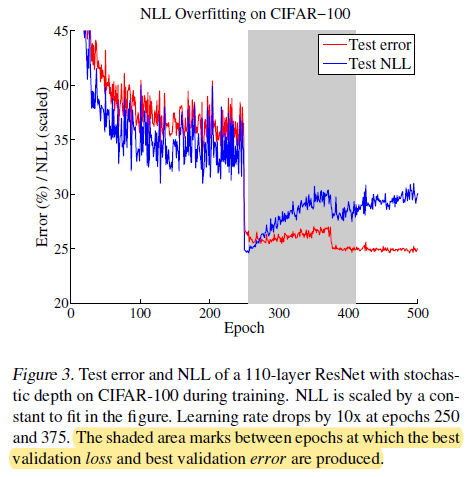
- NLL: 作者还绘制了训练过程中 Test NLL 和 Test error 的曲线,可以看到在训练后期,Test error 继续下降但 Test NLL 反而增加 (overfit to NLL without overfitting to the 0/1 loss),对 NLL 的过拟合导致了模型的 miscalibration (the network learns better classification accuracy at the expense of well-modeled probabilities)
Calibration Methods
- 下面作者探索了一些基于后处理的 calibration methods (Each method requires a hold-out validation set)
Calibrating Binary Models
对于二分类模型,只考虑对样本属于正类的概率 p i p_i pi 进行校准
- Histogram binning. 将预测概率值划分为
M
M
M 个 bins,bin boundaries 为
0
=
a
1
≤
a
2
≤
.
.
.
≤
a
M
+
1
=
1
0=a_1\leq a_2\leq...\leq a_{M+1}=1
0=a1≤a2≤...≤aM+1=1,bin
B
m
B_m
Bm 为
(
a
m
,
a
m
+
1
]
(a_m, a_{m+1}]
(am,am+1]. bin boundaries 可以根据 equal length intervals 或 equalize the number of samples in each bin 来选取。每个 bin 的 calibrated prediction
θ
m
\theta_m
θm 为
 即验证集上 bin
B
m
B_m
Bm 内样本的平均正样本数
 - Isotonic regression. Isotonic regression 是 Histogram binning 的推广,不仅优化 bin 对应的 calibrated prediction,还优化 bin boundaries. 相当于是学得 piecewise constant function
f
f
f 来进行概率值校准
q
^
i
=
f
(
p
^
i
)
\hat q_i=f(\hat p_i)
q^i=f(p^i) (这种校准模型是不是可以直接用决策树在验证集上训练?可以进一步参考 保序回归 Isotonic Regression-Python)

- Bayesian Binning into Quantiles (BBQ). 概率校准方法如下:
 其中,
D
D
D 为验证集,
s
∈
S
s\in\mathcal S
s∈S 为 binning scheme,包含 the number of bins
M
M
M, bin boundaries 和每个 bin 对应的输出校准概率值
θ
1
,
.
.
.
,
θ
M
\theta_1,...,\theta_M
θ1,...,θM。由于验证集是有限的,因此
S
\mathcal S
S 也是有限集合。
P
(
q
^
t
e
∣
p
^
t
e
,
S
=
s
,
D
)
\mathbb P(\hat q_{te}\mid\hat p_{te},\mathcal S=s,D)
P(q^te∣p^te,S=s,D) 为使用 binning scheme
s
s
s 输出的 calibrated probability. 当采用 uniform prior 时,有
 因此,关键就是解出
P
(
D
∣
S
=
s
)
\mathbb P(D\mid S=s)
P(D∣S=s),具体可参考 Naeini et al., 2015 (将
θ
1
,
.
.
,
θ
M
\theta_1,..,\theta_M
θ1,..,θM 看作
M
M
M 个独立二项分布的参数,用 Beta 分布来对
θ
1
,
.
.
,
θ
M
\theta_1,..,\theta_M
θ1,..,θM 进行建模)
 - Platt scaling. Platt scaling learns scalar parameters a , b ∈ R a, b \in \R a,b∈R and outputs q ^ i = σ ( a z i + b ) \hat q_i =\sigma(az_i + b) q^i=σ(azi+b) as the calibrated probability. 注意对 a , b a,b a,b 的训练是在验证集上通过优化 NLL loss 进行的 (实际上是一个 logistic regression model,但损失函数使用的是 NLL loss),并且这一过程中模型参数不变,只是使用模型输出的 logit 值进行训练
Extension to Multiclass Models
- Extension of binning methods. 把 K K K 分类问题拆分为 K K K 个二分类问题。对于第 k k k 个二分类问题,样本 i i i 的标签为 I ( y i = k ) \mathbb I(y_i=k) I(yi=k),预测概率值为 σ S M ( z i ) ( k ) \sigma_{SM}(z_i)^{(k)} σSM(zi)(k),其中 σ S M \sigma_{SM} σSM 为 softmax. 在测试时,只需将 K K K 个二分类问题得到的 K K K 个 calibrated prob 重新归一化即可
- Matrix and vector scaling. 它们都是 Platt scaling 在多分类上的推广。Matrix scaling 对 logit
z
i
z_i
zi 做线性变换,参数通过 NLL loss 在验证集上优化
 为了减小参数量,vector scaling 限制
W
W
W 为对角矩阵
 - Temperature scaling. the simplest extension of Platt scaling, uses a single scalar parameter
T
>
0
T > 0
T>0 for all classes.
T
T
T is optimized with respect to NLL on the validation set.
 其中,
q
^
i
\hat q_i
q^i 为 calibrated probability,
σ
S
M
\sigma_{SM}
σSM 为 softmax,
T
T
T 为 temperature,
T
T
T 越大,输出概率分布的熵越大。另外注意到,Temperature scaling does not affect the model’s accuracy (并不会对模型的预测结果产生影响) (On the other hand, binning methods tend to change class predictions which hurts accuracy)
Results
Calibration Results
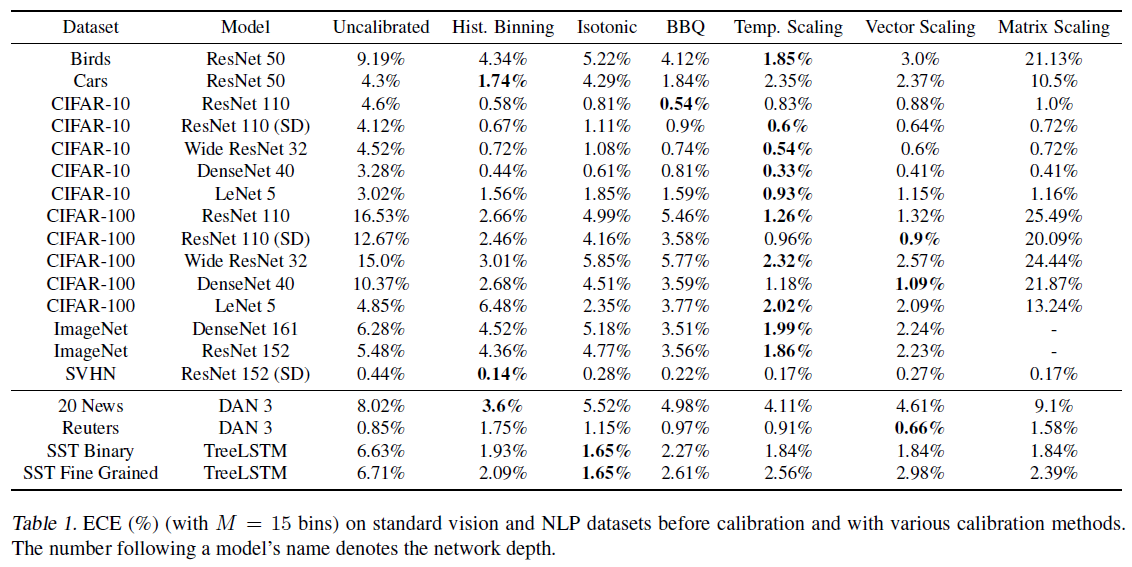
- Our most important discovery is the surprising effectiveness of temperature scaling despite its remarkable simplicity.
Reliability diagrams
Computation time
- All methods scale linearly with the number of validation set samples. Temperature scaling is by far the fastest method, as it amounts to a one-dimensional convex optimization problem.
Ease of implementation
- BBQ is arguably the most difficult to implement, as it requires implementing a model averaging scheme. While all other methods are relatively easy to implement, temperature scaling may arguably be the most straightforward to incorporate into a neural network pipeline.
References
-
相关阅读:
软件开发、网络空间安全、人工智能三个方向的就业和前景怎么样?哪个方向更值得学习?
system V共享内存
磕磕绊绊的双非硕秋招之路小结
最终稿第5部分理论知识考卷模拟
android 获取SD卡路径
C&Python:表达式的求值顺序(evaluation order)
易基因|性别分化:DNA甲基化表观遗传调控性别表型可塑性,诱导斑马鱼性别比例失调
SpringCloud之NamedContextFactory
hashSet解析
YoloV7改进策略:独家原创,LSKA(大可分离核注意力)改进YoloV7,比Transformer更有效,包括论文翻译和实验结果
- 原文地址:https://blog.csdn.net/weixin_42437114/article/details/128107852