-
Python图像处理【1】图像与视频处理
图像与视频处理基础
0. 前言
图像处理是指在计算机上使用算法和代码对图像进行自动处理、操作和分析,而视频处理是图像处理的一种特殊情况(视频文件或视频流有连续的图像序列构成)。图像和视频处理在许多领域都有应用广泛的应用,如电视、摄影、机器人、遥感、医学诊断和工业检查等。
在本节中,我们将聚焦一些简单的图像和视频处理问题,用于帮助我们理解图像和视频的基本概念。在我们开始分析图像/视频之前,我们需要使用合适的数据结构将图像加载到内存中,并且能够将处理后的图像/视频保存到文件中;能够在计算机屏幕上实时可视化(绘制)图像能够帮助我们立即观察到图像处理算法对图像的处理结果。1. 在 3D 空间中显示 RGB 图像颜色通道
1.1 图像表示
图像可以抽象为一个函数,并将其可视化,以进行进一步的分析/处理。灰度图像可以认为是像素位置的二元函数 f ( x , y ) f(x, y) f(x,y), f ( x , y ) f(x, y) f(x,y) 将每个像素映射到其相应灰度强度级别(
[0, 255]中的整数或[0, 1]中的浮点数),即:
f : ( x , y ) → R f:(x,y)→ R f:(x,y)→R
对于RGB图像,有三个这样的函数,可以表示为:
f : ( x , y ) → R f : ( x , y ) → G f : ( x , y ) → B f:(x,y)→ R \\ f:(x,y)→ G \\ f:(x,y)→ B f:(x,y)→Rf:(x,y)→Gf:(x,y)→B
其分别对应于每个通道及其色值,我们可以使用matplotlib库的三维绘图函数绘制以上函数,使用Python代码在3D空间中单独绘制每个RGB通道。1.2 在 3D 空间中绘制颜色通道
(1) 首先,导入所有必需的包。为了读取图像,我们需要
scikit-image库的io模块中的imread()函数;由于我们将图像加载为array类型,因此需要Numpy操作数据类型array;为了显示图像,我们将使用matplotlib.pyplot函数;对于3D图像的显示,我们需要使用mpl_toolkit库的mplt3d模块以及matplotlib库中的其他模块:from skimage.io import imread import numpy as np import matplotlib.pyplot as plt from mpl_toolkits.mplot3d import Axes3D from matplotlib import cm from matplotlib.ticker import LinearLocator, FormatStrFormatter- 1
- 2
- 3
- 4
- 5
- 6
(2) 使用
plot_surface()函数绘制通道的像素值,这是绘制3D图像的关键函数:Axes3D.plot_surface(X, Y, Z, *args, **kwargs)- 1
接下来,我们实现
plot_3d()的函数,在以下代码中,X轴和Y轴分别用于显示水平轴和垂直轴,Z轴用于显示图像的深度。需要注意的是,x、y和z的尺寸必须相同,cmap用于显示不同像素值的颜色映射:def plot_3d(x, y, z, cmap='Reds', title=''): fig = plt.figure(figsize=(15,15)) ax = fig.gca(projection='3d') # 曲面绘制 surf = ax.plot_surface(x, y, z, cmap=cmap, linewidth=0, antialiased=False, rstride=2, cstride=2, alpha=0.5) ax.xaxis.set_major_locator(LinearLocator(10)) ax.xaxis.set_major_formatter(FormatStrFormatter('%.02f')) ax.view_init(elev=10., azim=5) ax.set_title(title, size=20) plt.show()- 1
- 2
- 3
- 4
- 5
- 6
- 7
- 8
- 9
- 10
(3) 从磁盘读取
RGB图像,并使用scikit-image库io模块的imread()函数将其加载到内存中:skimage.io.imread(fname, as_gray=False, plugin=None, flatten=None, **plugin_args)- 1
使用
imread()函数从文件加载图像:im = imread('1.png')- 1
(4) 然后,使用
Numpy库的arange()和meshbrid()函数创建像素坐标 ( x , y ) (x, y) (x,y) 的二维网格:y = np.arange(im.shape[0]) x = np.arange(im.shape[1]) x, y = np.meshgrid(x, y)- 1
- 2
- 3
(5) 最后,将图像的红色、绿色和蓝色通道分别分配给相应变量,这些通道使用
plot_3D()函数以3D方式显示:z1 = im[...,0] z2 = im[...,1] z3 = im[...,2]- 1
- 2
- 3
(6) 在
3D空间中可视化图像,使用plot_3d()函数可视化RGB图像的颜色通道。使用Z轴作为深度轴,并从图像的高度中减去y轴值,以便将坐标原点从左上角移动到左侧中心点处。使用函数plot_3d()可视化红色通道:plot_3d(z1, x, im.shape[1]-y, cmap='Reds', title='3D plot for the Red Channel')- 1
红色通道的
3D绘图结果如下所示:
最后,再次使用函数
plot_3d()分别可视化输入图像的绿色通道和蓝色通道:plot_3d(z2, x, im.shape[1]-y, cmap='Greens', title='3D plot for the Green Channel') plot_3d(z3, x, im.shape[1]-y, cmap='Blues', title='3D plot for the Blue Channel')- 1
- 2
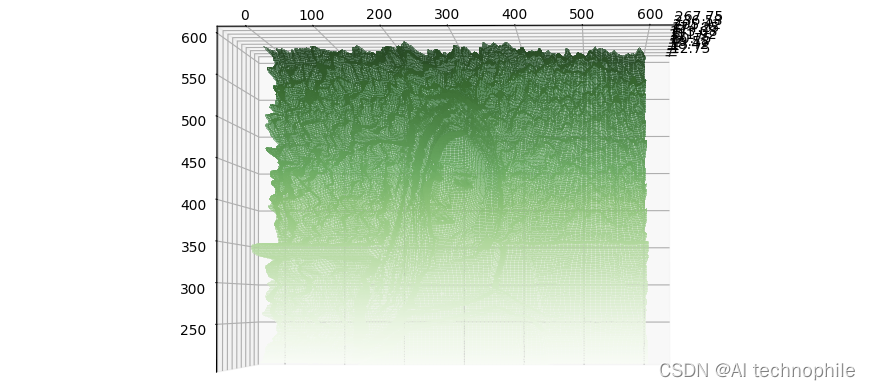

从以上绘图结果可以看出,每个通道中的颜色深度和
3D绘图结果在视觉上与原始2D图像类似。2. 使用 scikit-video 读/写视频文件
2.1 scikit-video 库
在本节中,我们将学习如何使用
scikit-video库函数从磁盘加载视频,该库使用FFmpeg软件执行视频I/O,因此首先需要安装FFmpeg后再安装scikit-video模块:pip3 install scikit-video- 1
2.2 读/写视频文件
首先导入所有必需的包:
import skvideo.io import numpy as np import matplotlib.pyplot as plt- 1
- 2
- 3
接下来,使用
FFmpegReader()函数从磁盘读取视频文件,并随机显示视频中的一些图像帧。函数FFmpegReader()的用法如下:skvideo.io.FFmpegReader(*args, **kwargs)- 1
使用
FFmpeg读取视频帧:inputparameters = {} outputparameters = {} reader = skvideo.io.FFmpegReader('example.mp4', inputdict=inputparameters, outputdict=outputparameters)- 1
- 2
- 3
- 4
- 5
2.3 提取视频文件属性
使用
getShape()方法以及FFmpegReader()函数返回的对象获取视频的帧数、高度、宽度和通道数等属性:# 读取视频文件属性 num_frames, height, width, num_channels = reader.getShape() print(num_frames, height, width, num_channels)- 1
- 2
- 3
2.4 读取并保存视频
使用
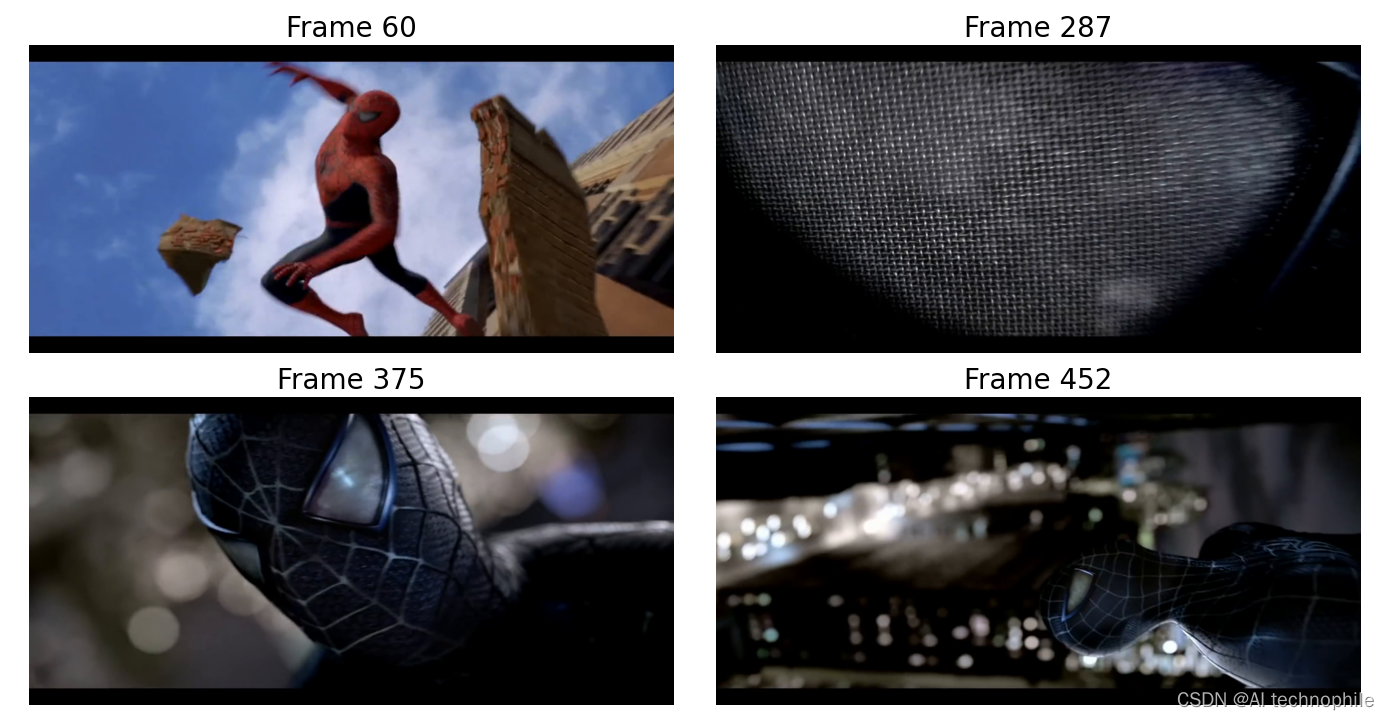
nextFrame()方法从视频中读取帧。通过使用NumPy的random.choice()函数随机选择四个帧,并显示这些帧:plt.figure(figsize=(20,10)) frame_list = np.random.choice(num_frames, 4) i, j = 0, 1 for frame in reader.nextFrame(): if i in frame_list: plt.subplot(2,2,j) plt.imshow(frame) plt.title("Frame {}".format(i), size=20) plt.axis('off') j += 1 i += 1 plt.show()- 1
- 2
- 3
- 4
- 5
- 6
- 7
- 8
- 9
- 10
- 11
- 12
- 13
二值图像是只有两个不同灰度值(黑色和白色)的图像,二值图像处理通常是图像处理应用程序的主要过程之一,例如,形态学图像处理算法通常需要输入二值图像开始。要计算二值图像,最简单的方法是使用阈值算法,高于阈值的像素变为白色,低于阈值的像素均变为黑色。
filters模块中的threshold_otsu()函数能够对视频中的帧进行阈值处理,threshold_otsu()函数能够将灰度图像转换为二值图像(在之后的学习中,我们会对其进行详细介绍)。
对每个颜色通道应用阈值以从图像帧中获得二值图像帧。使用FFmpegWriter()函数保存二值化视频,方法是按读取视频帧顺序依次叠加二值图像帧:from skimage.color import rgb2gray from skimage.filters import threshold_otsu writer = skvideo.io.FFmpegWriter("r2_binary.mp4", outputdict={}) for frame in skvideo.io.vreader("r3.mp4"): frame = rgb2gray(frame) thresh = threshold_otsu(frame) binary = np.zeros((frame.shape[0], frame.shape[1], 3), dtype=np.uint8) binary[...,0] = binary[...,1] = binary[...,2] = 255*(frame > thresh).astype(np.uint8) writer.writeFrame(binary) writer.close()- 1
- 2
- 3
- 4
- 5
- 6
- 7
- 8
- 9
- 10
- 11
最后,读取刚刚保存的二进制视频,然后显示一些随机帧:
plt.figure(figsize=(20,10)) reader = skvideo.io.FFmpegReader("example_binary.mp4") num_frames, height, width, num_channels = reader.getShape() frame_list = np.random.choice(num_frames, 4) i, j = 0, 1 for frame in reader.nextFrame(): if i in frame_list: plt.subplot(2,2,j) plt.imshow(frame) plt.title("Frame {}".format(i), size=20) plt.axis('off') j += 1 i += 1 plt.show()- 1
- 2
- 3
- 4
- 5
- 6
- 7
- 8
- 9
- 10
- 11
- 12
- 13
- 14
- 15

3. 使用 OpenCV 从相机捕获实时视频
在本节中,我们将学习如何使用
OpenCV库捕获视频并提取图像帧,同时我们将捕获摄像机(例如,笔记本电脑的内置网络摄像头或USB摄像头)录制的实时视频流。(1) 首先导入所需的库:
import cv2 import matplotlib.pyplot as plt- 1
- 2
(2) 要使用
OpenCV捕获视频,我们需要创建一个VideoCapture对象,它的参数可以是设备索引(实时视频)或视频文件的名称(本地文件):vc = cv2.VideoCapture(0) plt.ion() if vc.isOpened(): # 读取第一帧 is_capturing, frame = vc.read() webcam_preview = plt.imshow(cv2.cvtColor(frame, cv2.COLOR_BGR2RGB)) else: is_capturing = False- 1
- 2
- 3
- 4
- 5
- 6
- 7
设备索引是指定摄像机的整数数字,通常,如果只有一台相机连接到计算机,只需传递
0作为参数即可,如果有两台相机,则可以通过传递1来选择第二台相机,依次类推。
我们可以使用isOpened()方法检查VideoCapture对象是否正确初始化,如果正确初始化则返回true。如果返回true,那么我们可以使用函数read()读取第一帧以及所有后续帧。
read()函数是从设备捕获数据的最方便的方法,它返回捕获的视频帧。如果没有捕获到任何帧(摄像机已断开连接,或者视频文件中没有更多帧),则该方法返回false;使用布尔变量is_capturing确定是否可以捕获帧。(3) 一旦第一帧被正确读取,我们就可以在
while循环中逐帧捕获,直到视频的最后一帧。最后,一定要调用VideoCapture对象上的release()函数来释放设备。以下代码演示了如何捕获实时视频流的前十帧。需要注意的是,OpenCV使用BGR颜色格式,要显示具有真实RGB颜色的视频帧,必须使用转换函数cv2.cvtColor(frame, cv2.color_BGR2RGB):frame_index = 1 while is_capturing: if frame_index > 10: break is_capturing, frame = vc.read() image = cv2.cvtColor(frame, cv2.COLOR_BGR2RGB) webcam_preview.set_data(image) plt.title('Frame {0:d} '.format(frame_index)) plt.draw() frame_index += 1 try: # 避免由 plt.pause 引起的 NotImplementedError plt.pause(2) except Exception: Pass vc.release()- 1
- 2
- 3
- 4
- 5
- 6
- 7
- 8
- 9
- 10
- 11
- 12
- 13
- 14
- 15
如果连接到计算机的相机设备可以正常工作,那么运行以上代码时,就可以看到相机捕获到的实时图像。此外,
cv2.VideoCapture()函数也可用于从磁盘读取视频文件,相对应的,可以使用cv2.VideoWriter()函数可将视频文件保存到本地磁盘文件中。4. 实现 Gotham 图像滤镜
4.1 Gotham 图像滤镜
在本节中,我们将学习如何实现
Gotham图像滤镜用于增强图像效果,用于加强理解如何操作图像像素并执行插值操作。下图显示了我们将用于实现图像滤镜的输入图像:
首先,导入所需的库。在本节中,我们将使用
PIL库实现图像处理函数:from PIL import Image import numpy as np import matplotlib.pyplot as plt im = Image.open('images/Img_01_03.jpg') print(np.max(im))- 1
- 2
- 3
- 4
- 5
- 6
创建
Gotham滤波器需要在输入图像上应用中间色调(红色)对比度增强,这需要通过使用Numpy库的interp()函数完成的,利用 该函数实现通道插值。接下来,我们首先了解NumPy插值在一维情况空间中的工作原理。4.2 一维线性插值
当图像按缩放因子调整大小时,需要执行一些像素插值,以便在现有像素之间填充新像素值,我们可以使用
NumPy interp()函数执行插值操作。从NumPy文档中可以看到,interp()函数的一维线性插值基本用法如下:numpy.interp(x, left=None, right=None, period=None)- 1
interp()会返回具有给定离散数据点的函数的一维分段线性插值:x_p = np.linspace(0, 2*np.pi, 10) # 在间隔[0,2π]中生成10个均匀间隔的数字序列 y_p = np.cos(x_p) x = np.linspace(0, 2*np.pi, 50) # 在间隔[0,2π]中生成50个均匀间隔的数字序列 y = np.cos(x) y_interp = np.interp(x, x_p, y_p) plt.figure(figsize=(20,10)) plt.plot(x_p, y_p, 'o', label='reference points') plt.plot(x, y_interp, '-x', label='interpolated') plt.plot(x, y, '--', label='true') plt.legend(prop={'size': 16}) plt.show()- 1
- 2
- 3
- 4
- 5
- 6
- 7
- 8
- 9
- 10
- 11
- 12
假设我们希望(线性)插值区间 [ 0 , 2 π ] [0, 2π] [0,2π] 中余弦函数的值,最初区间中仅包含十个参考点。我们可以使用
interp()函数计算剩余点处函数的值,从给定点处函数值开始,然后应用线性插值。橙色曲线表示由interp()函数估计的曲线,绿色曲线显示真实的余弦曲线: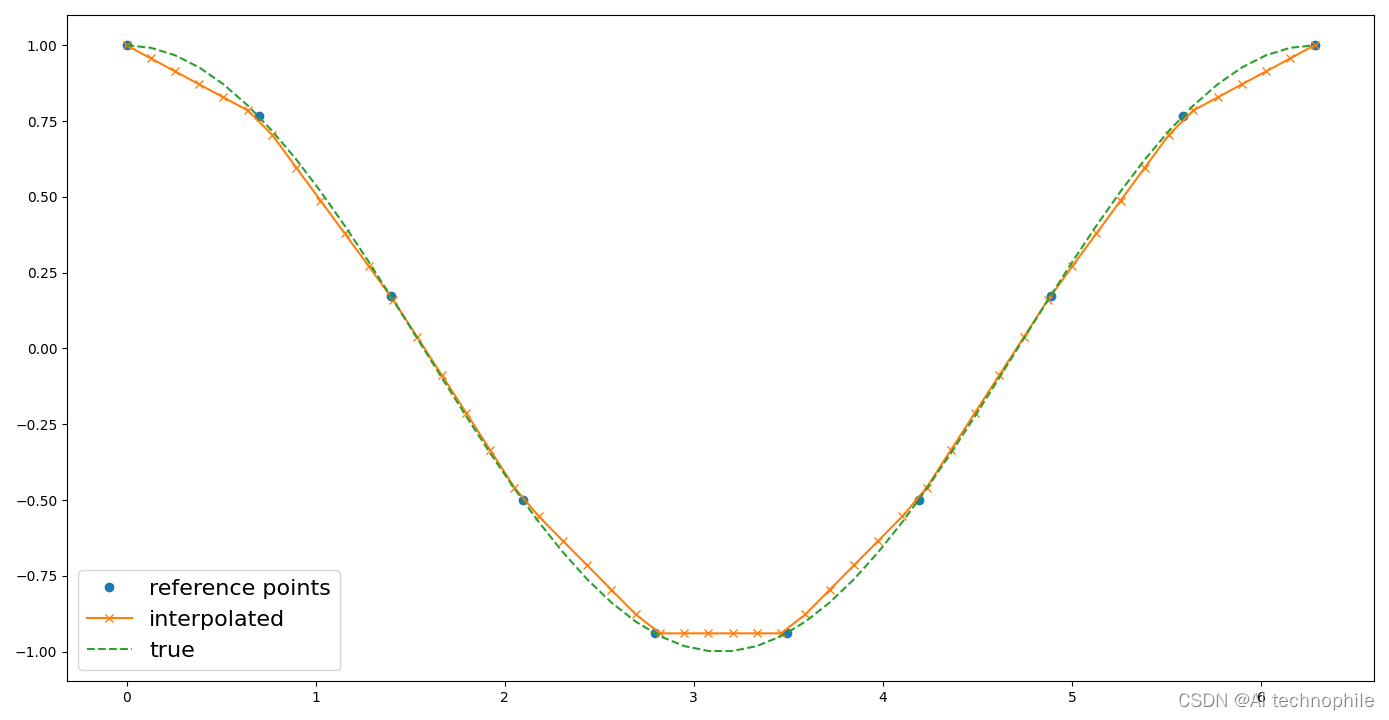
4.3 图像插值
可以以类似的方式扩展以上代码,使用
interp()函数计算R(红色)通道的通道内插值结果,由于图像的红色通道值本质上是一个2D阵列(矩阵),因此在将该函数应用于通道之前,需要执行以下操作:- 将
2D阵列展平为1D阵列(使用NumPy的ravel()函数) - 使用
interp()函数应用通道插值 - 将
1D阵列重新整形为图像矩阵(使用NumPy的整形函数)
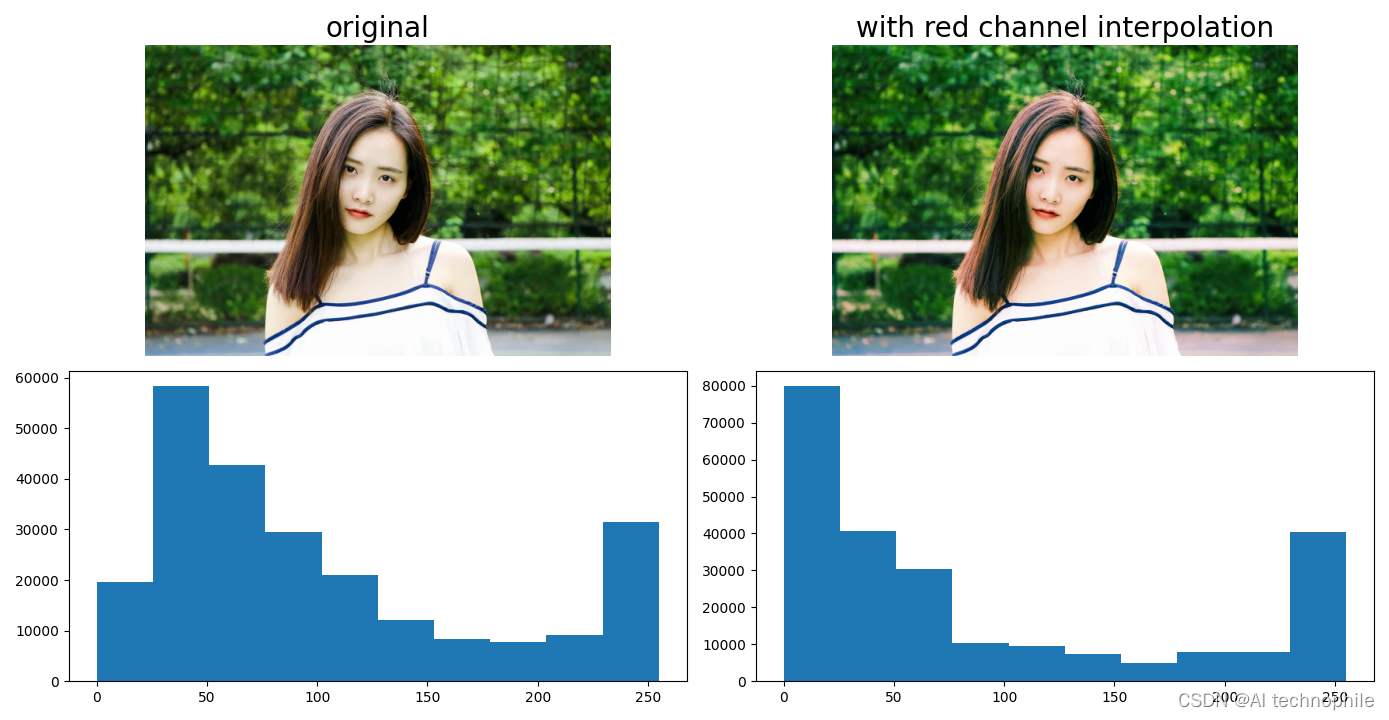
(1) 使用
np.interp()函数,用11个参考点拉伸红色通道直方图:r, g, b = im.split() # 分割图像通道为R、G和B r_old = np.linspace(0,255,11) # 参考点 r_new = [0., 12.75, 25.5, 51., 76.5, 127.5, 178.5, 204., 229.5, 242.25, 255.] # 参考点的新值 r1 = Image.fromarray((np.reshape(np.interp(np.array(r).ravel(), r_old, r_new), (im.height, im.width))).astype(np.uint8), mode='L')- 1
- 2
- 3
- 4
- 5
- 6
(2) 然后,绘制图像和红色通道直方图:
plt.figure(figsize=(20,15)) plt.subplot(221) plt.imshow(im) plt.title('original', size=20) plt.axis('off') plt.subplot(222) im1 = Image.merge('RGB', (r1, g, b)) plt.imshow(im1) plt.axis('off') plt.title('with red channel interpolation', size=20) plt.subplot(223) plt.hist(np.array(r).ravel()) plt.subplot(224) plt.hist(np.array(r1).ravel()) plt.show()- 1
- 2
- 3
- 4
- 5
- 6
- 7
- 8
- 9
- 10
- 11
- 12
- 13
- 14
- 15
下图显示了插值变换前后的图像:
(3) 通过使用以下代码,令黑色更接近蓝色值,我们将蓝色值增加了
7.65,并且使用函数np.clip()来确保新值保持在0到255区间内:plt.figure(figsize=(20,10)) plt.subplot(121) plt.imshow(im1) plt.title('last image', size=20) plt.axis('off') b1 = Image.fromarray(np.clip(np.array(b) + 7.65, 0, 255).astype(np.uint8)) im1 = Image.merge('RGB', (r1, g, b1)) plt.subplot(122) plt.imshow(im1) plt.axis('off') plt.title('with transformation', size=20) plt.tight_layout() plt.show()- 1
- 2
- 3
- 4
- 5
- 6
- 7
- 8
- 9
- 10
- 11
- 12
- 13
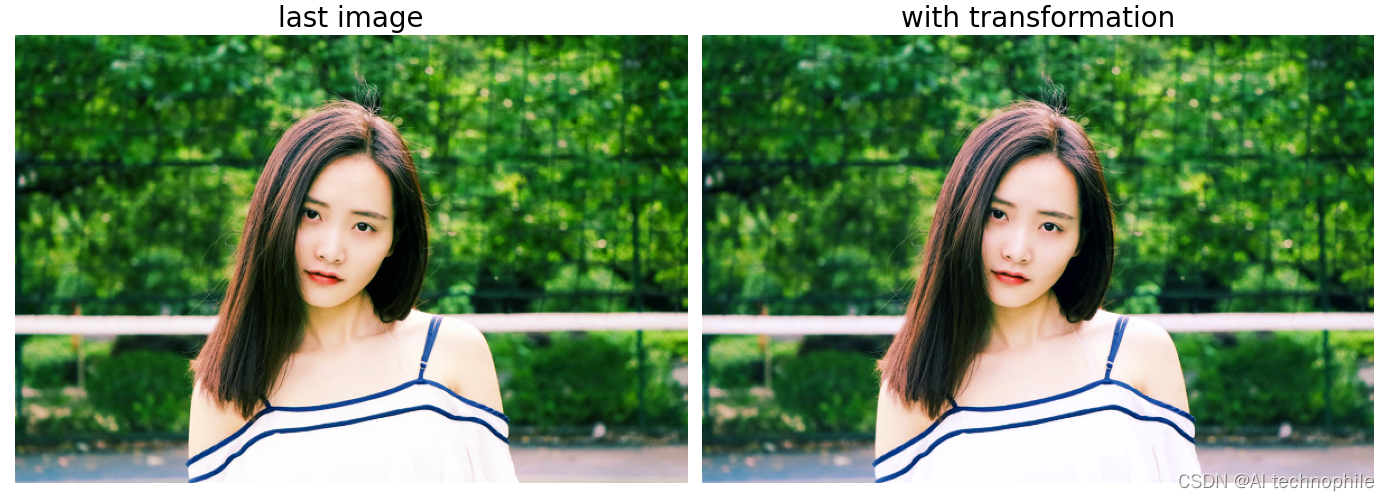
其中,matplotlib库的subplot模块用于显示子图,向当前图像中添加子图:subplot(nrows, ncols, index, **kwargs)- 1
如上图所示,使用
plt.subplot(121)创建具有一行和两列子图的图像,并使用索引参数index指定绘图位置。(4) 通过使用
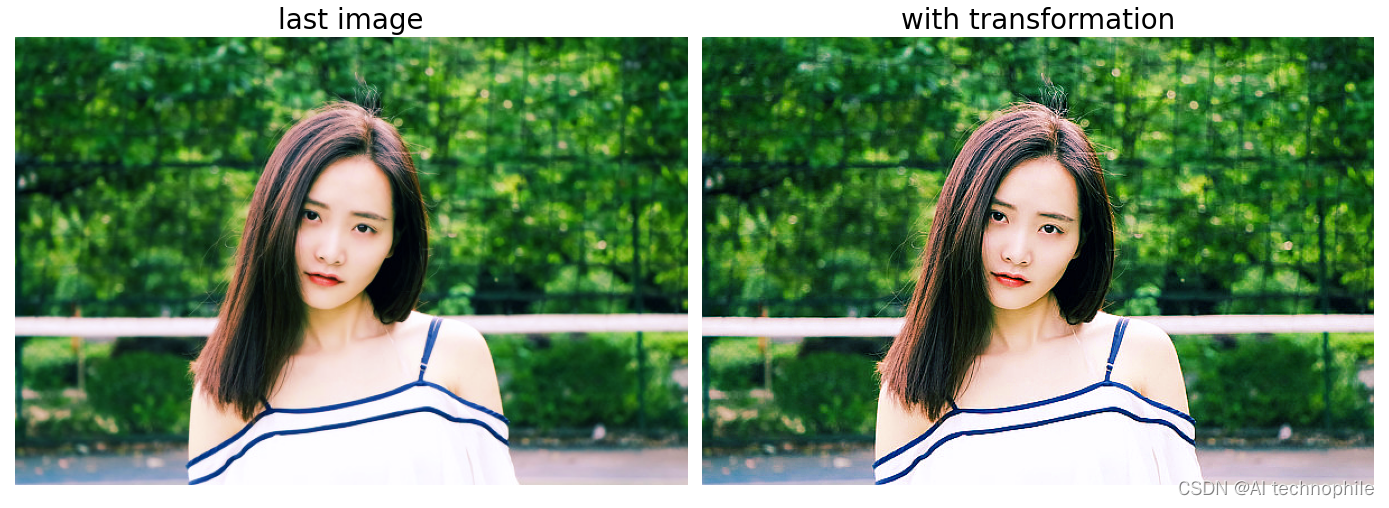
PIL库的ImageEnhance类中的Enhance()方法对图像执行较小的锐化:class PIL.ImageEnhance.Sharpness(image)- 1
ImageEnhance类可用于调整图像的清晰度,from PIL.ImageEnhance import Sharpness plt.figure(figsize=(20,10)) plt.subplot(121) plt.imshow(im1) plt.title('last image', size=20) plt.axis('off') im2 = Sharpness(im1).enhance(3.0) plt.subplot(122) plt.imshow(im2) plt.axis('off') plt.title('with transformation', size=20) plt.tight_layout() plt.show()- 1
- 2
- 3
- 4
- 5
- 6
- 7
- 8
- 9
- 10
- 11
- 12
- 13
- 14
(5) 减少蓝色通道的色调值,我们同样使用通道插值完成,但这次需要在
RGB图像的蓝色通道上进行:blue_old = np.linspace(0,255,17) # 参考点的像素值 blue_new = [0., 11.985, 30.09, 64.005, 81.09, 99.96, 107.1, 111.945, 121.125, 143.055, 147.9, 159.885, 171.105, 186.915, 215.985, 235.875, 255.] # 参考点的新像素值 b2 = Image.fromarray((np.reshape(np.interp(np.array(b1).ravel(), blue_old, blue_new), (im.height, im.width))).astype(np.uint8), mode='L')- 1
- 2
- 3
- 4
- 5
- 6
绘制图像以及蓝色通道直方图如下:
plt.figure(figsize=(20,15)) plt.subplot(221) plt.imshow(im2) plt.title('last image', size=20) plt.axis('off') plt.subplot(222) im3 = Image.merge('RGB', (r1, g, b2)) plt.imshow(im3) plt.axis('off') plt.title('with blue channel interpolation', size=20) plt.subplot(223) plt.hist(np.array(b1).ravel(), normed=True) plt.subplot(224) plt.hist(np.array(b2).ravel(), normed=True) plt.show()- 1
- 2
- 3
- 4
- 5
- 6
- 7
- 8
- 9
- 10
- 11
- 12
- 13
- 14
- 15

(5) 最后,我们展示应用Gotham滤镜生成的最终输出图像:plt.figure(figsize=(20,15)) plt.imshow(im3) plt.axis('off') plt.show()- 1
- 2
- 3
- 4

小结
图像和视频是大数据时代重要的交流媒介,图像和视频处理是当今人工智能技术重点的研究领域。在本节中,我们学习了如何使用
Python执行基本的图像/视频处理,我们首先学习在3D空间可视化RGB图像的三个通道;然后,介绍了如何捕获视频并提取图像帧;最后,我们展示了如何实现一种流形的图像滤镜Gotham,用于理解如何操作图像像素并执行插值操作。系列链接
Python图像处理【2】探索Python图像处理库
Python图像处理【3】探索Python图像处理库
Python图像处理【4】图像线性变换
Python图像处理【5】图像扭曲与逆扭曲详解
Python图像处理【6】通过哈希查找重复和类似的图像 -
相关阅读:
android U广播详解(一)
Vue3 SFC 和 TSX 方式自定义组件实现 v-model
理解 iOS 开发中的 NS_ENUM 和 NS_OPTIONS
什么品牌的蓝牙耳机音质最好?音质好的蓝牙耳机推荐
ubuntu ffmpeg 合成字幕 字体缺失selecting one more font for
用OKR工作法让2023年的自己的薪酬翻倍
《痞子衡嵌入式半月刊》 第 98 期
【Glide 】框架在内存使用方面的优化
树莓派无桌面配置WiFi连接
GitHub 的 9 种加速方式
- 原文地址:https://blog.csdn.net/qq_30167691/article/details/128026801