-
GMM算法
高斯混合模型聚类(Gaussian Mixture Mode,GMM)
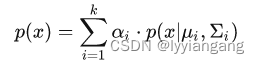
高斯混合模型是一种概率式的聚类方法,它假定所有的数据样本x由k个混合多元高斯分布组合成的混合分布生成。
其中高斯分布的概率密度函数如下:
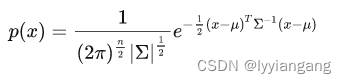
现在的问题就是如何求 α , μ , σ \alpha,\mu,\sigma α,μ,σ- 求解
最大化极大似然函数:
 由于无法计算解析解,这里可使用EM算法进行迭代求解,具体细节参考链接.
使用GMM进行人脸图像分割(人脸检测)
import numpy as np import matplotlib.pyplot as plt from sklearn.mixture import GaussianMixture import cv2 import matplotlib as mpl import glob import os def draw_polygon(img, pts): for pt in pts.reshape(-1, 2).astype(np.int32): # import ipdb; ipdb.set_trace() cv2.circle(img, tuple(pt),2, (0, 0, 255)) def find_target_contour(mask, ncls): biggest_contours = [] all_areas = [] area_threshold = mask.shape[0] * mask.shape[1] /5 for label in range(ncls): mask_a = (mask == label).astype(np.uint8) contours, hierarchy = cv2.findContours(mask_a, cv2.RETR_TREE, cv2.CHAIN_APPROX_SIMPLE) areas = [cv2.contourArea(item) for item in contours] idx = np.argmax(areas) biggest_contours.append(contours[idx].reshape(-1, 2)) all_areas.append(areas[idx]) # only keep 2 region which take big area biggest_contours = np.asarray(biggest_contours) all_areas = np.asarray(all_areas) # import ipdb; ipdb.set_trace() biggest_contours = biggest_contours[all_areas > area_threshold] # if len(biggest_contours) # find whilch contour is closer to bottom of img centers = np.array([np.mean(item, axis = 0) for item in biggest_contours] ) idx = np.argmax(centers[:, 1]) selected_contours = biggest_contours[idx] rect = np.min(selected_contours, axis = 0), np.max(selected_contours, axis = 0) return np.array(rect), selected_contours def run(): # dataset_root = 'data/' dataset_root = 'tmp' imgs = glob.glob(os.path.join(dataset_root, '*.png')) ncls = 3 for iimg, cur_path in enumerate(imgs): print(f'[{iimg}/{len(imgs)}].reading {cur_path}') img = cv2.imread(cur_path) npts = img.shape[0] * img.shape[1] classifier = GaussianMixture(ncls) input_img = cv2.blur(img, (5, 5)) classifier.fit(input_img.reshape(npts, 3)) colors = [0, 80, 125, 180, 255] labels = classifier.predict(img.reshape(npts, 3)) mask = labels.reshape(*img.shape[:2]).astype(np.uint8) kernel = cv2.getStructuringElement(cv2.MORPH_RECT, (5,5)) eroded = cv2.erode(mask, kernel) mask = cv2.dilate(eroded, kernel) rect, mask_contour = find_target_contour(mask, ncls) labels = np.expand_dims(labels, -1) for px in labels: px[:] = colors[px[0]] binary_img = labels.reshape(*img.shape[:2]) plt.figure(figsize = (11, 4)) plt.subplot(121) draw_polygon(img, mask_contour) rect = rect.astype(np.int32) cv2.rectangle(img, tuple(rect[0]), tuple(rect[1]), (0, 255, 255), 4) rgb_img = cv2.cvtColor(img, cv2.COLOR_BGR2RGB) plt.imshow(rgb_img) plt.axis('off') plt.subplot(122) plt.imshow(binary_img, cmap = mpl.colormaps['viridis'], interpolation= 'nearest') plt.axis('off') plt.show() run()- 1
- 2
- 3
- 4
- 5
- 6
- 7
- 8
- 9
- 10
- 11
- 12
- 13
- 14
- 15
- 16
- 17
- 18
- 19
- 20
- 21
- 22
- 23
- 24
- 25
- 26
- 27
- 28
- 29
- 30
- 31
- 32
- 33
- 34
- 35
- 36
- 37
- 38
- 39
- 40
- 41
- 42
- 43
- 44
- 45
- 46
- 47
- 48
- 49
- 50
- 51
- 52
- 53
- 54
- 55
- 56
- 57
- 58
- 59
- 60
- 61
- 62
- 63
- 64
- 65
- 66
- 67
- 68
- 69
- 70
- 71
- 72
- 73
- 74
- 75
- 76
- 77
- 78
- 79
- 80
从下图可以看出,肤色相近的区域都被识别成了一个区域,对于一些简单的任务GMM还是能很好处理的。

- EM(Expectation-maximization algorithm)期望最大化算法
最大期望(EM)算法是在概率模型中寻找参数最大似然估计或者最大后验估计的算法,其中概率模型依赖于无法观测的隐变量。最大期望算法经过两个步骤交替进行计算,第一步是计算期望(E),利用对隐藏变量的现有估计值,计算其最大似然估计值;第二步是最大化(M),最大化在E步上求得的最大似然值来计算参数的值。M步上找到的参数估计值被用于下一个E步计算中,这个过程不断交替进行。
- 求解
-
相关阅读:
项目管理的优秀软件推荐,助力提升团队效能!
基于springboot实现致远汽车租赁平台管理系统项目【项目源码+论文说明】计算机毕业设计
xlwings笔记
【21天学习经典算法】冒泡排序(附Python完整代码)
字符串中第二大的数字(遍历)
node.js+室内装修风格选择系统 毕业设计-附源码211552
【Python】读取显示pgm图像文件
Gorm源码学习-数据库连接
【excel密码】excel文件加密的三种方式
筛选图片,写JSON文件和复制
- 原文地址:https://blog.csdn.net/lyyiangang/article/details/128100077
