-
ggVennDiagram--绘制简单美观不同调色板的韦恩图1
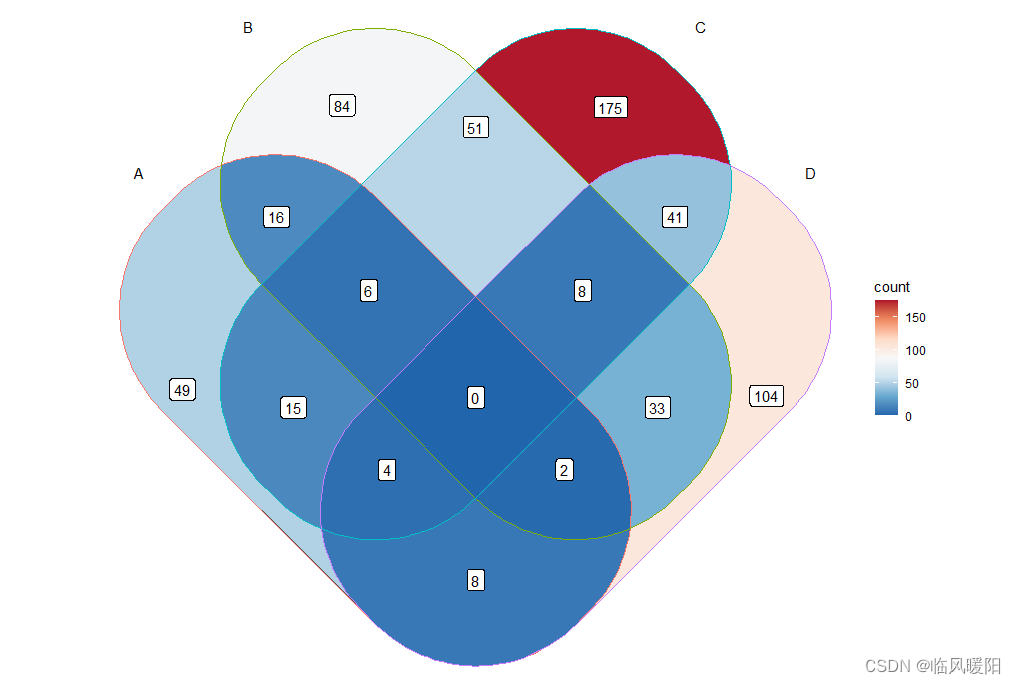
library(ggVennDiagram) library(ggplot2) genes <- paste0("gene",1:1000) set.seed(20210701) gene_list <- list(A = sample(genes,100), B = sample(genes,200), C = sample(genes,300), D = sample(genes,200)) # construct a Venn object venn = Venn(gene_list) data = process_data(venn, shape_id == "401") ggplot() + geom_sf(aes(fill = count), data = venn_region(data)) + geom_sf(aes(color = id), data = venn_setedge(data), show.legend = FALSE) + geom_sf_text(aes(label = name), data = venn_setlabel(data)) + geom_sf_label(aes(label = count), data = venn_region(data)) + theme_void()+ scale_fill_distiller(palette = "RdBu")- 1
- 2
- 3
- 4
- 5
- 6
- 7
- 8
- 9
- 10
- 11
- 12
- 13
- 14
- 15
- 16
- 17
- 18
- 19
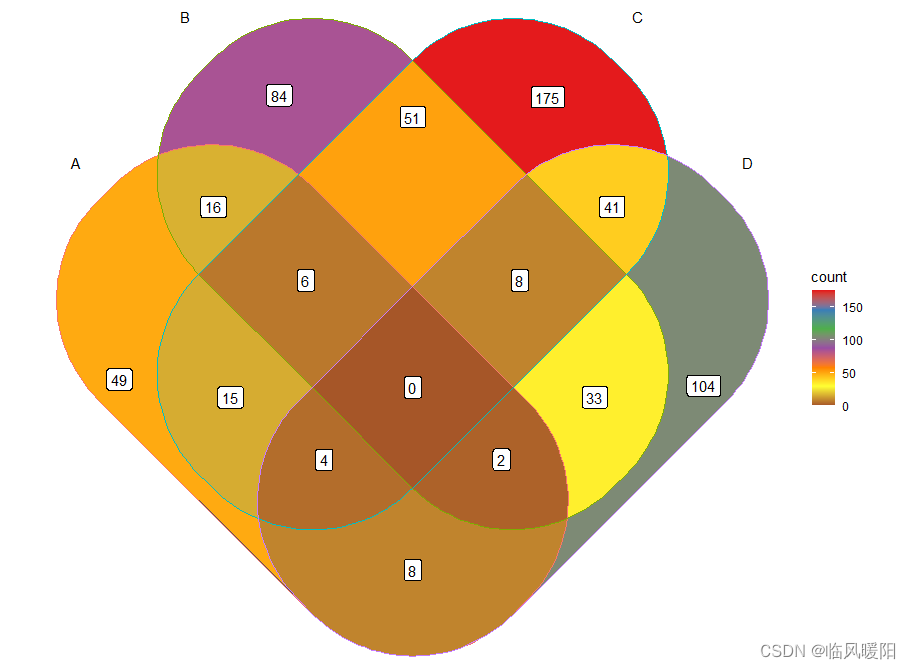
ggplot() + geom_sf(aes(fill = count), data = venn_region(data)) + geom_sf(aes(color = id), data = venn_setedge(data), show.legend = FALSE) + geom_sf_text(aes(label = name), data = venn_setlabel(data)) + geom_sf_label(aes(label = count), data = venn_region(data)) + theme_void()+ scale_fill_distiller(palette = "Set1")- 1
- 2
- 3
- 4
- 5
- 6
ggplot() + geom_sf(aes(fill = count), data = venn_region(data)) + geom_sf(aes(color = id), data = venn_setedge(data), show.legend = FALSE) + geom_sf_text(aes(label = name), data = venn_setlabel(data)) + geom_sf_label(aes(label = count), data = venn_region(data)) + theme_void()+ scale_fill_distiller(palette = "Set2")- 1
- 2
- 3
- 4
- 5
- 6

ggplot() + geom_sf(aes(fill = count), data = venn_region(data)) + geom_sf(aes(color = id), data = venn_setedge(data), show.legend = FALSE) + geom_sf_text(aes(label = name), data = venn_setlabel(data)) + geom_sf_label(aes(label = count), data = venn_region(data)) + theme_void()+ scale_fill_distiller(palette = "Set3")- 1
- 2
- 3
- 4
- 5
- 6

ggplot() + geom_sf(aes(fill = count), data = venn_region(data)) + geom_sf(aes(color = id), data = venn_setedge(data), show.legend = FALSE) + geom_sf_text(aes(label = name), data = venn_setlabel(data)) + geom_sf_label(aes(label = count), data = venn_region(data)) + theme_void()+ scale_fill_distiller(palette = "Pastel1")- 1
- 2
- 3
- 4
- 5
- 6

ggplot() + geom_sf(aes(fill = count), data = venn_region(data)) + geom_sf(aes(color = id), data = venn_setedge(data), show.legend = FALSE) + geom_sf_text(aes(label = name), data = venn_setlabel(data)) + geom_sf_label(aes(label = count), data = venn_region(data)) + theme_void()+ scale_fill_distiller(palette = "Pastel2")- 1
- 2
- 3
- 4
- 5
- 6
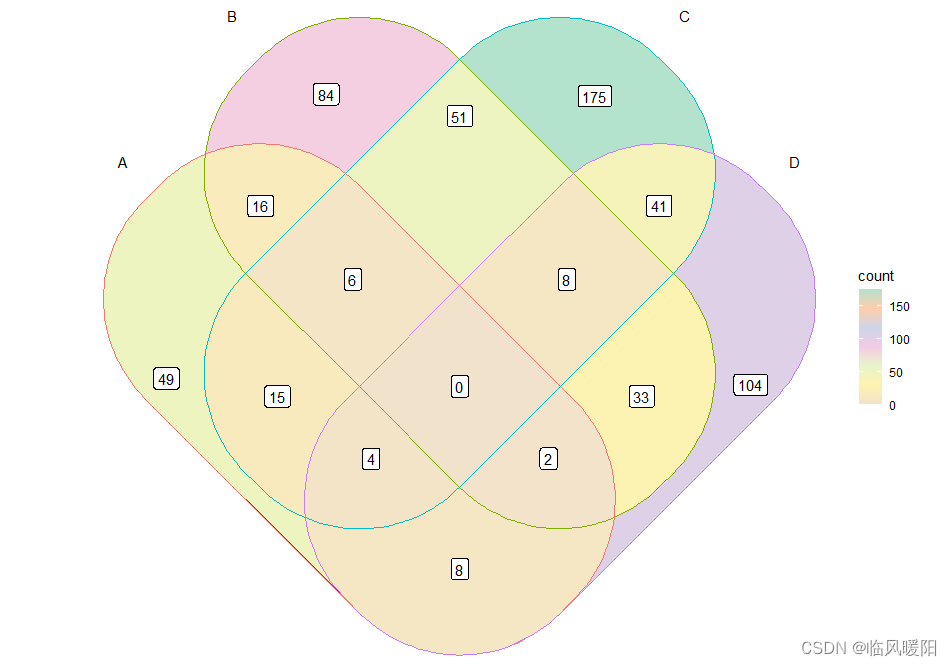
ggplot() + geom_sf(aes(fill = count), data = venn_region(data)) + geom_sf(aes(color = id), data = venn_setedge(data), show.legend = FALSE) + geom_sf_text(aes(label = name), data = venn_setlabel(data)) + geom_sf_label(aes(label = count), data = venn_region(data)) + theme_void()+ scale_fill_distiller(palette = "Pastel3")- 1
- 2
- 3
- 4
- 5
- 6

ggplot() + geom_sf(aes(fill = count), data = venn_region(data)) + geom_sf(aes(color = id), data = venn_setedge(data), show.legend = FALSE) + geom_sf_text(aes(label = name), data = venn_setlabel(data)) + geom_sf_label(aes(label = count), data = venn_region(data)) + theme_void()+ scale_fill_distiller(palette = "Paired")- 1
- 2
- 3
- 4
- 5
- 6
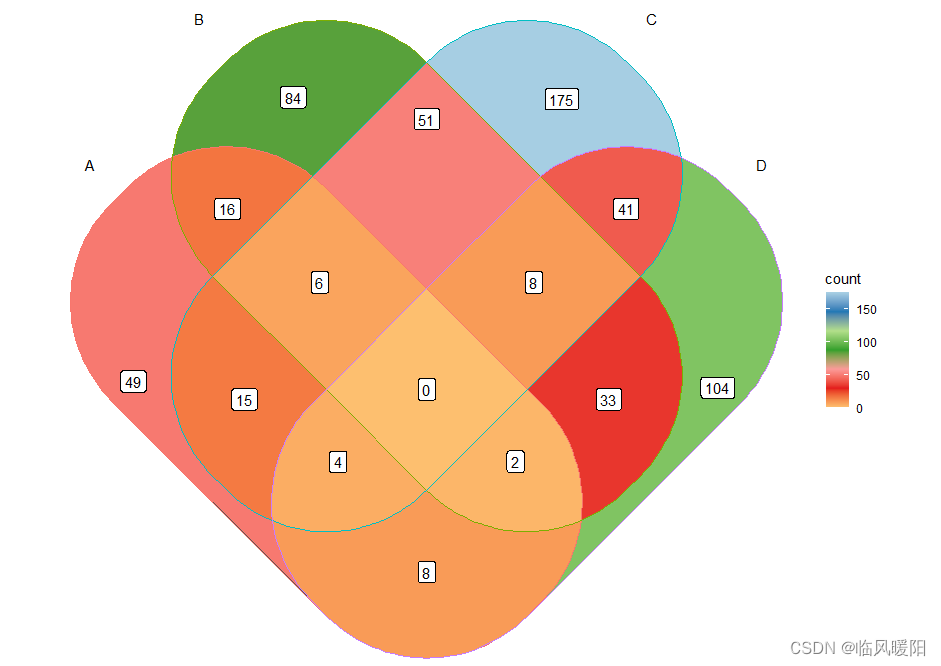
ggplot() + geom_sf(aes(fill = count), data = venn_region(data)) + geom_sf(aes(color = id), data = venn_setedge(data), show.legend = FALSE) + geom_sf_text(aes(label = name), data = venn_setlabel(data)) + geom_sf_label(aes(label = count), data = venn_region(data)) + theme_void()+ scale_fill_distiller(palette = "Darked2")- 1
- 2
- 3
- 4
- 5
- 6

ggplot() + geom_sf(aes(fill = count), data = venn_region(data)) + geom_sf(aes(color = id), data = venn_setedge(data), show.legend = FALSE) + geom_sf_text(aes(label = name), data = venn_setlabel(data)) + geom_sf_label(aes(label = count), data = venn_region(data)) + theme_void()+ scale_fill_distiller(palette = "Accent")- 1
- 2
- 3
- 4
- 5
- 6

ggplot() + geom_sf(aes(fill = count), data = venn_region(data)) + geom_sf(aes(color = id), data = venn_setedge(data), show.legend = FALSE) + geom_sf_text(aes(label = name), data = venn_setlabel(data)) + geom_sf_label(aes(label = count), data = venn_region(data)) + theme_void()+ scale_fill_distiller(palette = "Spectral")- 1
- 2
- 3
- 4
- 5
- 6

ggplot() + geom_sf(aes(fill = count), data = venn_region(data)) + geom_sf(aes(color = id), data = venn_setedge(data), show.legend = FALSE) + geom_sf_text(aes(label = name), data = venn_setlabel(data)) + geom_sf_label(aes(label = count), data = venn_region(data)) + theme_void()+ scale_fill_distiller(palette = "RdYlGn")- 1
- 2
- 3
- 4
- 5
- 6
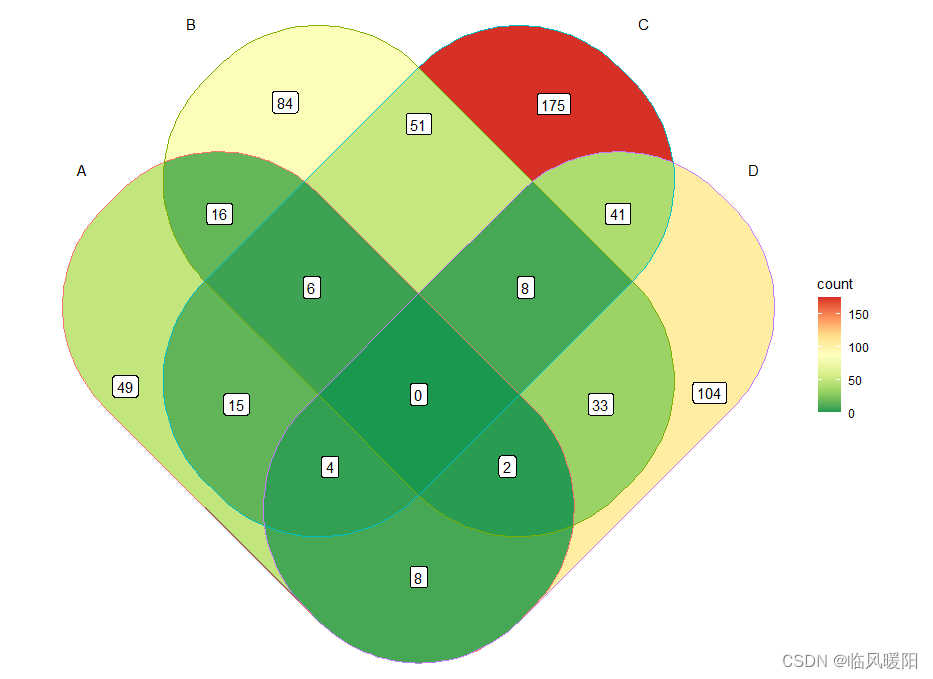
ggplot() + geom_sf(aes(fill = count), data = venn_region(data)) + geom_sf(aes(color = id), data = venn_setedge(data), show.legend = FALSE) + geom_sf_text(aes(label = name), data = venn_setlabel(data)) + geom_sf_label(aes(label = count), data = venn_region(data)) + theme_void()+ scale_fill_distiller(palette = "RdYlBu")- 1
- 2
- 3
- 4
- 5
- 6

ggplot() + geom_sf(aes(fill = count), data = venn_region(data)) + geom_sf(aes(color = id), data = venn_setedge(data), show.legend = FALSE) + geom_sf_text(aes(label = name), data = venn_setlabel(data)) + geom_sf_label(aes(label = count), data = venn_region(data)) + theme_void()+ scale_fill_distiller(palette = "RdGy")- 1
- 2
- 3
- 4
- 5
- 6

ggplot() + geom_sf(aes(fill = count), data = venn_region(data)) + geom_sf(aes(color = id), data = venn_setedge(data), show.legend = FALSE) + geom_sf_text(aes(label = name), data = venn_setlabel(data)) + geom_sf_label(aes(label = count), data = venn_region(data)) + theme_void()+ scale_fill_distiller(palette = "RdBu")- 1
- 2
- 3
- 4
- 5
- 6

ggplot() + geom_sf(aes(fill = count), data = venn_region(data)) + geom_sf(aes(color = id), data = venn_setedge(data), show.legend = FALSE) + geom_sf_text(aes(label = name), data = venn_setlabel(data)) + geom_sf_label(aes(label = count), data = venn_region(data)) + theme_void()+ scale_fill_distiller(palette = "YlOrRd")- 1
- 2
- 3
- 4
- 5
- 6

ggplot() + geom_sf(aes(fill = count), data = venn_region(data)) + geom_sf(aes(color = id), data = venn_setedge(data), show.legend = FALSE) + geom_sf_text(aes(label = name), data = venn_setlabel(data)) + geom_sf_label(aes(label = count), data = venn_region(data)) + theme_void()+ scale_fill_distiller(palette = "YlOrBr")- 1
- 2
- 3
- 4
- 5
- 6

ggplot() + geom_sf(aes(fill = count), data = venn_region(data)) + geom_sf(aes(color = id), data = venn_setedge(data), show.legend = FALSE) + geom_sf_text(aes(label = name), data = venn_setlabel(data)) + geom_sf_label(aes(label = count), data = venn_region(data)) + theme_void()+ scale_fill_distiller(palette = "YlGnBu")- 1
- 2
- 3
- 4
- 5
- 6

ggplot() + geom_sf(aes(fill = count), data = venn_region(data)) + geom_sf(aes(color = id), data = venn_setedge(data), show.legend = FALSE) + geom_sf_text(aes(label = name), data = venn_setlabel(data)) + geom_sf_label(aes(label = count), data = venn_region(data)) + theme_void()+ scale_fill_distiller(palette = "YlGn")- 1
- 2
- 3
- 4
- 5
- 6

ggplot() + geom_sf(aes(fill = count), data = venn_region(data)) + geom_sf(aes(color = id), data = venn_setedge(data), show.legend = FALSE) + geom_sf_text(aes(label = name), data = venn_setlabel(data)) + geom_sf_label(aes(label = count), data = venn_region(data)) + theme_void()+ scale_fill_distiller(palette = "Reds")- 1
- 2
- 3
- 4
- 5
- 6

ggplot() + geom_sf(aes(fill = count), data = venn_region(data)) + geom_sf(aes(color = id), data = venn_setedge(data), show.legend = FALSE) + geom_sf_text(aes(label = name), data = venn_setlabel(data)) + geom_sf_label(aes(label = count), data = venn_region(data)) + theme_void()+ scale_fill_distiller(palette = "RdPu")- 1
- 2
- 3
- 4
- 5
- 6

ggplot() + geom_sf(aes(fill = count), data = venn_region(data)) + geom_sf(aes(color = id), data = venn_setedge(data), show.legend = FALSE) + geom_sf_text(aes(label = name), data = venn_setlabel(data)) + geom_sf_label(aes(label = count), data = venn_region(data)) + theme_void()+ scale_fill_distiller(palette = "Purples")- 1
- 2
- 3
- 4
- 5
- 6

ggplot() + geom_sf(aes(fill = count), data = venn_region(data)) + geom_sf(aes(color = id), data = venn_setedge(data), show.legend = FALSE) + geom_sf_text(aes(label = name), data = venn_setlabel(data)) + geom_sf_label(aes(label = count), data = venn_region(data)) + theme_void()+ scale_fill_distiller(palette = "PuRd")- 1
- 2
- 3
- 4
- 5
- 6

ggplot() + geom_sf(aes(fill = count), data = venn_region(data)) + geom_sf(aes(color = id), data = venn_setedge(data), show.legend = FALSE) + geom_sf_text(aes(label = name), data = venn_setlabel(data)) + geom_sf_label(aes(label = count), data = venn_region(data)) + theme_void()+ scale_fill_distiller(palette = "PuBuGn")- 1
- 2
- 3
- 4
- 5
- 6

ggplot() + geom_sf(aes(fill = count), data = venn_region(data)) + geom_sf(aes(color = id), data = venn_setedge(data), show.legend = FALSE) + geom_sf_text(aes(label = name), data = venn_setlabel(data)) + geom_sf_label(aes(label = count), data = venn_region(data)) + theme_void()+ scale_fill_distiller(palette = "PuBu")- 1
- 2
- 3
- 4
- 5
- 6

ggplot() + geom_sf(aes(fill = count), data = venn_region(data)) + geom_sf(aes(color = id), data = venn_setedge(data), show.legend = FALSE) + geom_sf_text(aes(label = name), data = venn_setlabel(data)) + geom_sf_label(aes(label = count), data = venn_region(data)) + theme_void()+ scale_fill_distiller(palette = "OrRd")- 1
- 2
- 3
- 4
- 5
- 6

ggplot() + geom_sf(aes(fill = count), data = venn_region(data)) + geom_sf(aes(color = id), data = venn_setedge(data), show.legend = FALSE) + geom_sf_text(aes(label = name), data = venn_setlabel(data)) + geom_sf_label(aes(label = count), data = venn_region(data)) + theme_void()+ scale_fill_distiller(palette = "Oranges")- 1
- 2
- 3
- 4
- 5
- 6

ggplot() + geom_sf(aes(fill = count), data = venn_region(data)) + geom_sf(aes(color = id), data = venn_setedge(data), show.legend = FALSE) + geom_sf_text(aes(label = name), data = venn_setlabel(data)) + geom_sf_label(aes(label = count), data = venn_region(data)) + theme_void()+ scale_fill_distiller(palette = "Greys")- 1
- 2
- 3
- 4
- 5
- 6
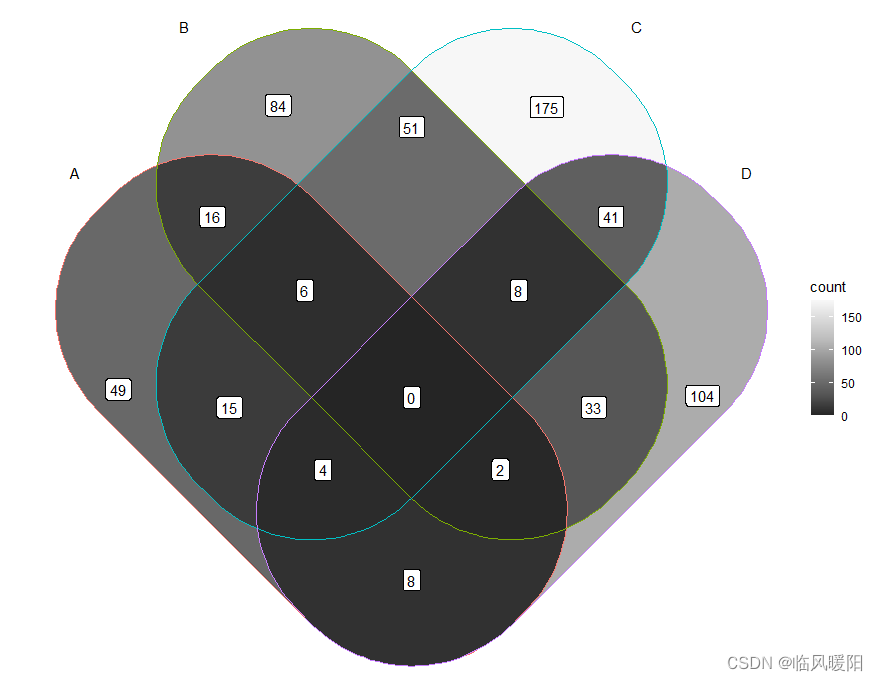
ggplot() + geom_sf(aes(fill = count), data = venn_region(data)) + geom_sf(aes(color = id), data = venn_setedge(data), show.legend = FALSE) + geom_sf_text(aes(label = name), data = venn_setlabel(data)) + geom_sf_label(aes(label = count), data = venn_region(data)) + theme_void()+ scale_fill_distiller(palette = "Greens")- 1
- 2
- 3
- 4
- 5
- 6

ggplot() + geom_sf(aes(fill = count), data = venn_region(data)) + geom_sf(aes(color = id), data = venn_setedge(data), show.legend = FALSE) + geom_sf_text(aes(label = name), data = venn_setlabel(data)) + geom_sf_label(aes(label = count), data = venn_region(data)) + theme_void()+ scale_fill_distiller(palette = "GnBu")- 1
- 2
- 3
- 4
- 5
- 6

ggplot() + geom_sf(aes(fill = count), data = venn_region(data)) + geom_sf(aes(color = id), data = venn_setedge(data), show.legend = FALSE) + geom_sf_text(aes(label = name), data = venn_setlabel(data)) + geom_sf_label(aes(label = count), data = venn_region(data)) + theme_void()+ scale_fill_distiller(palette = "BuPu")- 1
- 2
- 3
- 4
- 5
- 6

ggplot() + geom_sf(aes(fill = count), data = venn_region(data)) + geom_sf(aes(color = id), data = venn_setedge(data), show.legend = FALSE) + geom_sf_text(aes(label = name), data = venn_setlabel(data)) + geom_sf_label(aes(label = count), data = venn_region(data)) + theme_void()+ scale_fill_distiller(palette = "BuGn")- 1
- 2
- 3
- 4
- 5
- 6
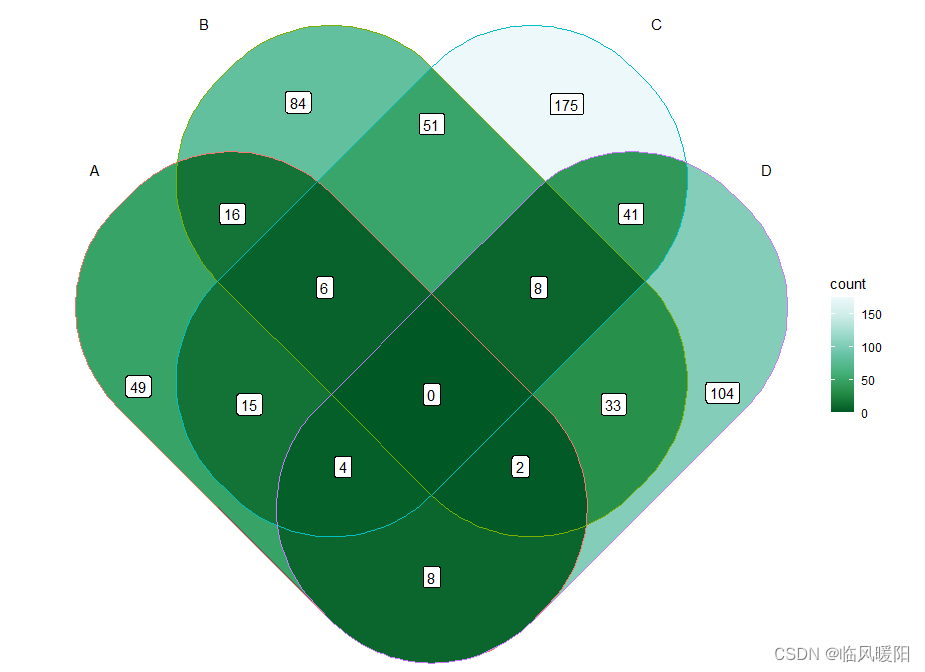
ggplot() + geom_sf(aes(fill = count), data = venn_region(data)) + geom_sf(aes(color = id), data = venn_setedge(data), show.legend = FALSE) + geom_sf_text(aes(label = name), data = venn_setlabel(data)) + geom_sf_label(aes(label = count), data = venn_region(data)) + theme_void()+ scale_fill_distiller(palette = "Blues")- 1
- 2
- 3
- 4
- 5
- 6

参考文献:
https://cloud.tencent.com/developer/article/1965941
开发工具:RStudio和微信截屏工具 -
相关阅读:
Nanoframework 操作单片机蓝牙配置WIFI的案例
【极客时间2】左耳听风
Repetition Improves Language Model Embeddings
细说 单链表、双向链表 、LinkedList类(附 add 源码解读)和 ArrayList 和 LinkedList 的区别 —— 数据结构
vue2人脸检测录入
numpy学习大纲
恶意代码防范技术笔记(二)
《工程伦理与学术道德》第四章习题
文件的基本操作(创建文件,删除文件,读写文件,打开文件,关闭文件)
【愚公系列】2022年6月 ASP.NET Core下CellReport报表工具基本介绍和使用
- 原文地址:https://blog.csdn.net/m0_38127487/article/details/127830645
