-
在python中使用ggplot2
python的ggplot2库:plotnine >一.安装方法:
pip install plotnine- 1
使用的编译器:pycharm
二.plotnine绘图
1.第一个图形
除了导包的操作不一致,其他类似
from plotnine import ggplot, geom_point, aes, stat_smooth, facet_wrap from plotnine.data import mtcars (ggplot(mtcars, aes('wt', 'mpg', color='factor(gear)')) + geom_point() + stat_smooth(method='lm') + facet_wrap('~gear'))- 1
- 2
- 3
- 4
- 5
- 6
- 7
如果你和我一样使用的是pycharm这个图形可能不会显示,我们需要先对其赋值,然后print出来
from plotnine import ggplot, geom_point, aes, stat_smooth, facet_wrap from plotnine.data import mtcars a = (ggplot(mtcars, aes('wt', 'mpg', color='factor(gear)')) + geom_point() + stat_smooth(method='lm') + facet_wrap('~gear')) print(a)- 1
- 2
- 3
- 4
- 5
- 6
- 7
- 8

2.小提琴图+散点图+箱线图
先来看一下语法:
geom_violin(mapping=None, data=None, stat='ydensity', position='dodge', na_rm=False, inherit_aes=True, show_legend=None, raster=False, trim=True, scale='area', width=None, style='full', draw_quantiles=None, **kwargs)- 1
- 2
- 3
- 4
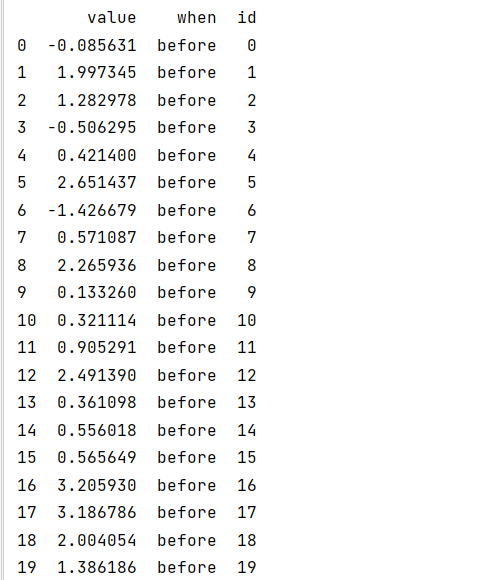
Aesthetic Default value x y alpha 1color '#333333'fill 'white'group linetype 'solid'size 0.5weight 1首先我们生成一组数据:
import pandas as pd import numpy as np import pandas.api.types as pdtypes from plotnine import * from plotnine.data import * np.random.seed(123) # 设置随机数种子 n = 20 mu = (1, 2.3) sigma = (1, 1.6) before = np.random.normal(loc=mu[0], scale=sigma[0], size=n) after = np.random.normal(loc=mu[1], scale=sigma[1], size=n) df = pd.DataFrame({ 'value': np.hstack([before, after]), 'when': np.repeat(['before', 'after'], n), 'id': np.hstack([range(n), range(n)]) }) df['when'] = df['when'].astype(pdtypes.CategoricalDtype(categories=['before', 'after'])) print(df)- 1
- 2
- 3
- 4
- 5
- 6
- 7
- 8
- 9
- 10
- 11
- 12
- 13
- 14
- 15
- 16
- 17
- 18
- 19
- 20
- 21
- 22
- 23
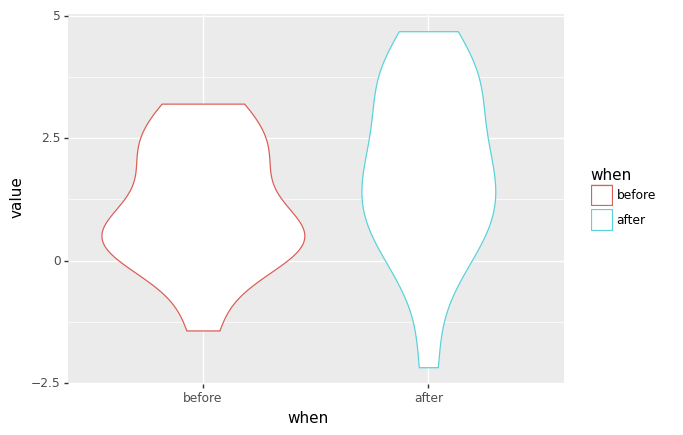
先绘制一个小提琴图:
a = ggplot(df, aes("when", "value")) + geom_violin(df, aes(colour="when")) print(a)- 1
- 2
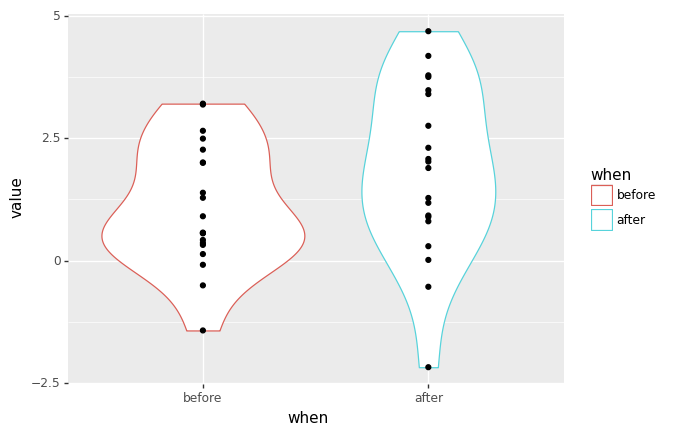
在小提琴图的基础上加上散点
a = ggplot(df, aes("when", "value")) + geom_violin(df, aes(colour="when")) + geom_point() print(a)- 1
- 2
- 3
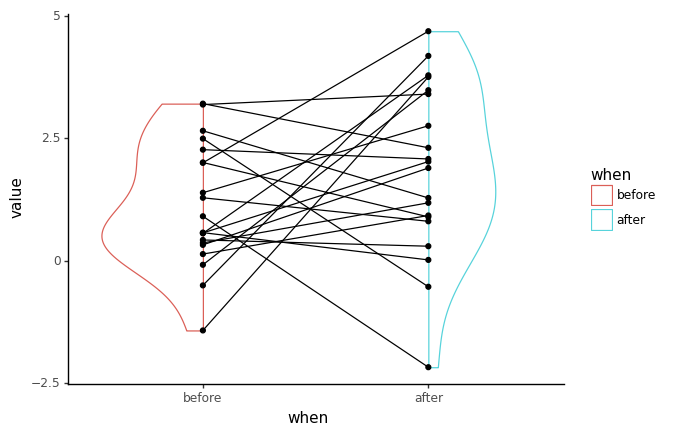
小提琴在垂直轴上是对称的,半把小提琴和整把小提琴具有相同的信息。我们把小提琴切成两半,第一半用左半交替,第二半用右半交替。
a = ggplot(df, aes("when", "value")) + geom_violin(df, aes(colour="when"),style="left-right") + geom_point() print(a)- 1
- 2

将这些点连接起来,以便了解数据是如何移动的。
a=(ggplot(df, aes('when', 'value')) + geom_violin(df, style='left-right') # changed + geom_point() + geom_line(aes(group='id')) # new ) print(a)- 1
- 2
- 3
- 4
- 5
- 6

3.使用theme添加主题
a = ggplot(df, aes("when", "value")) + geom_violin(df, aes(colour="when"),style="left-right") + geom_point() + geom_line( aes(group="id")) + theme_classic() print(a)- 1
- 2
- 3
- 4
三.最终的图形
#%% shift = 0.1 def alt_sign(x): "Alternate +1/-1 if x is even/odd" return (-1) ** x m1 = aes(x=stage('when', after_scale='x+shift*alt_sign(x)')) # shift outward m2 = aes(x=stage('when', after_scale='x-shift*alt_sign(x)'), group='id') # shift inward lsize = 0.65 fill_alpha = 0.7 (ggplot(df, aes('when', 'value', fill='when')) + geom_violin(m1, style='left-right', alpha=fill_alpha, size=lsize, show_legend=False) + geom_point(m2, color='none', alpha=fill_alpha, size=2, show_legend=False) + geom_line(m2, color='gray', size=lsize, alpha=0.6) + geom_boxplot(width=shift, alpha=fill_alpha, size=lsize, show_legend=False) + scale_fill_manual(values=['dodgerblue', 'darkorange']) + theme_classic() + theme(figure_size=(8, 6)) )- 1
- 2
- 3
- 4
- 5
- 6
- 7
- 8
- 9
- 10
- 11
- 12
- 13
- 14
- 15
- 16
- 17
- 18
- 19
- 20
- 21
- 22
- 23

-
相关阅读:
怎么把pdf压缩的小一点?
Spring之Bean生命周期源码解析
java-php-python-ssm-在线投稿系统-计算机毕业设计
Windows 10压缩卷参数错误怎么办?
CentOS7和CentOS8 Asterisk 20.0.0 简单图形化界面3--安装dahdi驱动
多线程 - 阻塞式队列
CUE语言基础入门:CUE是一门为配置而生的语言
docker搭建hadoop集群 个人总结
【算法-动态规划】最长公共子序列
uni-app小程序开发使用uView,u-model传入富文本内容过长,真机上无法滚动
- 原文地址:https://blog.csdn.net/qq_54423921/article/details/127579488

- 最新文章
-
【FHE】我们如何实现同态加密推理(八):SiLU 的密文化——两条路径,和一个 8 字节的开关
SQLcl 中 c/old/new 替换变量为何失效?先定位再替换
不让模型写作文,直接从它脑子里读答案:Jev 决策在 .NET 的两条路线
Halo插件:支持GitHub的图床附件策略
电视投屏界的“一股清流”!SimpleTVCast 6.0.0-beta 抢先体验:无需TV端App,界面大换血!✨
华三VXLAN集中式网关实战指南:Spine多活网关 + 双活接入(M-LAG)
软件更好写之后口碑会更重要
大 O、大 Omega、大 Theta 的区别,O(n) 复杂度是什么意思
Java标签跳转:一个鲜为人知但却很实用的小技巧
多智能体系统论文速读