-
【Machine Learning】17.多分类问题
之前说的都是简单的二分类问题,今天扩展到多分类问题
1.导入
import numpy as np import matplotlib.pyplot as plt %matplotlib widget from sklearn.datasets import make_blobs import tensorflow as tf from tensorflow.keras.models import Sequential from tensorflow.keras.layers import Dense np.set_printoptions(precision=2) from lab_utils_multiclass_TF import * import logging logging.getLogger("tensorflow").setLevel(logging.ERROR) tf.autograph.set_verbosity(0)- 1
- 2
- 3
- 4
- 5
- 6
- 7
- 8
- 9
- 10
- 11
- 12
2.多分类问题
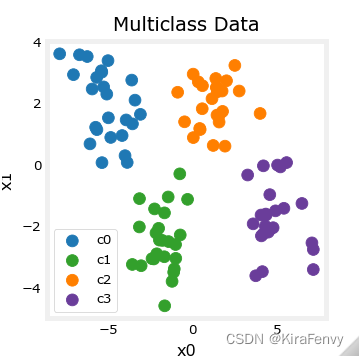
此类网络的最后一层将有多个单元。每个输出都与一个类别相关联。当输入示例应用于网络时,具有最大值的输出是预测的类别。如果输出应用于softmax函数,则softmax的输出将提供输入在每个类别中的概率。
2.1 加载并可视化数据
加载数据
# make 4-class dataset for classification classes = 4 m = 100 centers = [[-5, 2], [-2, -2], [1, 2], [5, -2]] std = 1.0 X_train, y_train = make_blobs(n_samples=m, centers=centers, cluster_std=std,random_state=30)- 1
- 2
- 3
- 4
- 5
- 6
def plt_mc(X_train,y_train,classes, centers, std): css = np.unique(y_train) fig,ax = plt.subplots(1,1,figsize=(3,3)) fig.canvas.toolbar_visible = False fig.canvas.header_visible = False fig.canvas.footer_visible = False plt_mc_data(ax, X_train,y_train,classes, map=dkcolors_map, legend=True, size=50, equal_xy = False) ax.set_title("Multiclass Data") ax.set_xlabel("x0") ax.set_ylabel("x1") #for c in css: # circ = plt.Circle(centers[c], 2*std, color=dkcolors_map(c), clip_on=False, fill=False, lw=0.5) # ax.add_patch(circ) plt.show() plt_mc(X_train,y_train,classes, centers, std=std)- 1
- 2
- 3
- 4
- 5
- 6
- 7
- 8
- 9
- 10
- 11
- 12
- 13
- 14
- 15
- 16

# show classes in data set print(f"unique classes {np.unique(y_train)}") # show how classes are represented print(f"class representation {y_train[:10]}") # show shapes of our dataset print(f"shape of X_train: {X_train.shape}, shape of y_train: {y_train.shape}") unique classes [0 1 2 3] class representation [3 3 3 0 3 3 3 3 2 0] shape of X_train: (100, 2), shape of y_train: (100,)- 1
- 2
- 3
- 4
- 5
- 6
- 7
- 8
- 9
- 10
- 11
2.2 模型
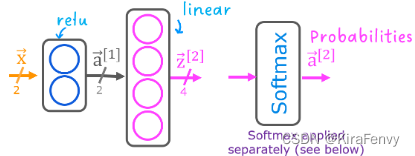
将使用如图所示的2层网络。

与二分类网络不同,该网络有四个输出,每类一个。给定一个输入示例,具有最大值的输出是输入的预测类。
下面是如何在Tensorflow中构建此网络的示例。请注意,输出层使用“linear”而不是“softmax”激活。虽然可以将softmax包含在输出层中,但如果在训练期间将linear输出传递给损失函数,则数值更稳定。如果模型用于预测概率,则可以在该点应用softmax。
tf.random.set_seed(1234) # applied to achieve consistent results model = Sequential( [ Dense(2, activation = 'relu', name = "L1"), Dense(4, activation = 'linear', name = "L2") ] ) model.compile( loss=tf.keras.losses.SparseCategoricalCrossentropy(from_logits=True), optimizer=tf.keras.optimizers.Adam(0.01), ) model.fit( X_train,y_train, epochs=200 )- 1
- 2
- 3
- 4
- 5
- 6
- 7
- 8
- 9
- 10
- 11
- 12
- 13
- 14
- 15
- 16
数据可视化
def plt_mc_data(ax, X, y, classes, class_labels=None, map=plt.cm.Paired, legend=False, size=50, m='o', equal_xy = False): """ Plot multiclass data. Note, if equal_xy is True, setting ylim on the plot may not work """ for i in range(classes): idx = np.where(y == i) col = len(idx[0])*[i] label = class_labels[i] if class_labels else "c{}".format(i) #ax.scatter(X[idx, 0], X[idx, 1], marker=m, # c=col, vmin=0, vmax=map.N, cmap=map, # s=size, label=label) ax.scatter(X[idx, 0], X[idx, 1], marker=m, color=map(col), vmin=0, vmax=map.N, s=size, label=label) if legend: ax.legend() if equal_xy: ax.axis("equal") plt_cat_mc(X_train, y_train, model, classes)- 1
- 2
- 3
- 4
- 5
- 6
- 7
- 8
- 9
- 10
- 11
- 12
- 13
- 14
- 15
- 16
- 17

上面的决策边界显示了模型如何划分输入空间。这个非常简单的模型对训练数据进行分类没有任何困难。它是如何做到这一点的?让我们更详细地了解一下网络。下面,我们将从模型中提取经过训练的权重,并使用它来绘制每个网络单元的函数。更进一步,有一个更详细的结果解释。你不需要知道这些细节就可以成功地使用神经网络,但它可能有助于获得关于层如何结合来解决分类问题的更多直觉。
首先看看第一层relu过后产生了什么
# gather the trained parameters from the first layer l1 = model.get_layer("L1") W1,b1 = l1.get_weights()- 1
- 2
- 3
def plt_layer_relu(X, Y, W1, b1, classes): nunits = (W1.shape[1]) Y = Y.reshape(-1,) fig,ax = plt.subplots(1,W1.shape[1], figsize=(7,2.5)) fig.canvas.toolbar_visible = False fig.canvas.header_visible = False fig.canvas.footer_visible = False for i in range(nunits): layerf= lambda x : np.maximum(0,(np.dot(x,W1[:,i]) + b1[i])) plt_prob_z(ax[i], layerf) plt_mc_data(ax[i], X, Y, classes, map=dkcolors_map,legend=True, size=50, m='o') ax[i].set_title(f"Layer 1 Unit {i}") ax[i].set_ylabel(r"$x_1$",size=10) ax[i].set_xlabel(r"$x_0$",size=10) fig.tight_layout() plt.show() # plot the function of the first layer plt_layer_relu(X_train, y_train.reshape(-1,), W1, b1, classes)- 1
- 2
- 3
- 4
- 5
- 6
- 7
- 8
- 9
- 10
- 11
- 12
- 13
- 14
- 15
- 16
- 17
- 18
- 19

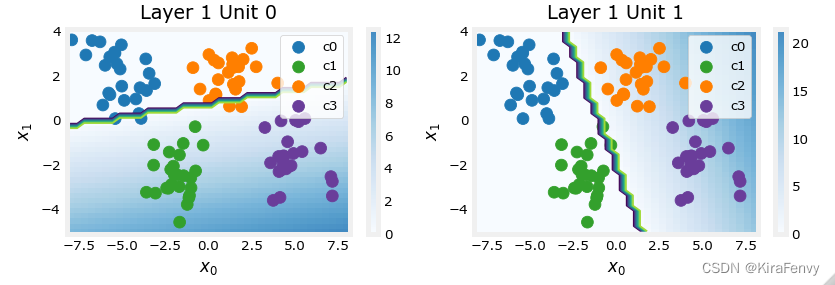
- 这些图显示了网络第一层中单元0和1的功能。轴上的输入为( x 0 , x 1 x_0,x_1 x0,x1)。单元的输出由背景颜色表示。这由每个图形右侧的颜色条表示。注意,由于这些单元使用ReLu,输出不一定在0和1之间,在这种情况下,峰值大于20。
- 此图中的轮廓线显示输出 a j [ 1 ] a^{[1]}_j aj[1]为零和非零之间的边界,这条线的白色那边都是0
- Unit 0将类0和1与类2和3分隔开。线左侧的点(类0和类1)将输出零,而右侧的点将输出大于零的值。
- Unit 1 将0级和2级与1级和3级分开。直线的上面的点(类0和2中)将输出零,而下面的点将输出大于零的值。

第二层之后发生了什么
# gather the trained parameters from the output layer l2 = model.get_layer("L2") W2, b2 = l2.get_weights() # create the 'new features', the training examples after L1 transformation Xl2 = np.zeros_like(X_train) Xl2 = np.maximum(0, np.dot(X_train,W1) + b1) plt_output_layer_linear(Xl2, y_train.reshape(-1,), W2, b2, classes, x0_rng = (-0.25,np.amax(Xl2[:,0])), x1_rng = (-0.25,np.amax(Xl2[:,1])))- 1
- 2
- 3
- 4
- 5
- 6
- 7
- 8
- 9

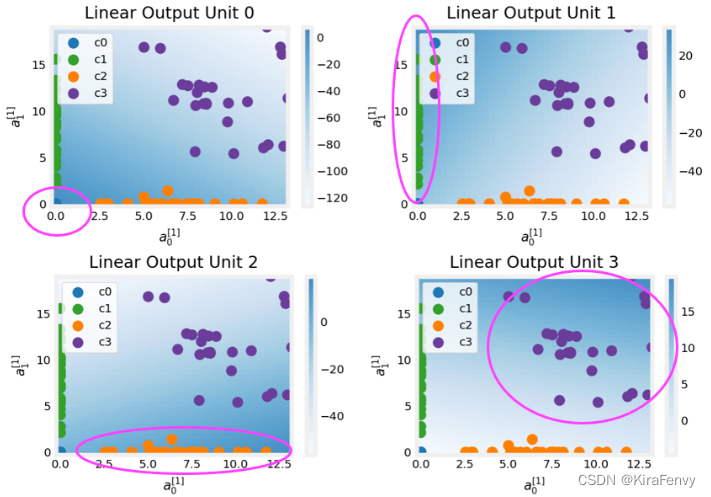
这些图中的点是第一层翻译的训练示例。一种方法是,第一层创建了一组新的功能,供第二层评估。这些绘图中的轴是前一层 a 0 [ 1 ] a^{[1]}_0 a0[1]和 a 1 [ 1 ] a^{[1]}_1 a1[1]的输出。如上所述,类0和1(绿色和蓝色)有 a 0 [ 1 ] = 0 a^{[1]}_0=0 a0[1]=0,而类1和2(蓝色和绿色)有 a 1 [ 1 ] = 0 a ^{[1]}_1=0 a1[1]=0。同样,背景色的强度表示最高值。
Unit0将为接近(0,0)的值生成其最大值,其中类0(蓝色)已映射。
Unit1在左上角产生最高值,选择class 1(绿色)。
Unit2的目标是3级(橙色)所在的右下角。
Unit3在右上角产生最高值,选择我们的最后一个类(紫色)。
图中不明显的另一个方面是,各单位之间的值已经协调。一个单位仅为它所选择的类别产生最大值是不够的,它还必须是该类别中所有units的最高值。这是通过作为损失函数(
SparseCategoricalCrossEntropy)一部分的隐含softmax函数实现的。与其他激活功能不同,softmax适用于所有输出。你可以成功地使用神经网络,而不需要知道每个unit的详细情况。希望这个例子能够提供一些帮助

-
相关阅读:
JavaEE中的Lambda表达式与方法引用的使用
基于SSM的医院科室人员管理系统
Nginx多IP端口路由配置
【Vue+Element-UI】实现登陆注册界面及axios之get、post请求登录功能实现、跨域问题的解决
8.Spring EL与ExpressionParser
CNVD-2021-09650:锐捷NBR路由器(guestIsUp.php)RCE漏洞复现 [附POC]
83页智慧小区智能化设计方案
【数据库数据恢复】linux操作系统下MYSQL数据库恢复案例
Splunk API : {“preview“:false,“lastrow“:true}
4、Kafka 消费者
- 原文地址:https://blog.csdn.net/m0_51371693/article/details/127196158
