-
MindSpore数据集加载-调试小工具 py-spy
编写MindSpore数据集加载代码的时候,有时候会遇到一些迷惑的代码行为,比如不知道代码卡在哪里不动了,似乎处理的很慢,或者写了死循环的逻辑。这些问题往往会花费很多精力打点去调试python代码,那么有没有方便的工具帮我们这么做呢
—— 有请今天的主角:py-spy
py-spy 介绍
引用官方的话:
py-spy是Python程序的采样分析器。它可以让您可视化Python程序花费的时间在什么上,而无需重新启动程序或以任何方式修改代码。py-spy开销极低:它是用Rust编写的,以提高速度,并且与分析的Python程序不在相同的进程中运行。这意味着py-spy可以安全地用于生产Python代码。
官方github地址:https://github.com/benfred/py-spy 如果有相关的问题也可以去github提问。
py-spy 安装
pip install py-spy
安装后使用
py-spy -h可以验证安装,并查看使用帮助。py-spy -h
- py-spy 0.3.12
- Sampling profiler for Python programs
- USAGE:
- py-spy <SUBCOMMAND>
- OPTIONS:
- -h, --help Print help information
- -V, --version Print version information
- SUBCOMMANDS:
- record Records stack trace information to a flamegraph, speedscope or raw file
- top Displays a top like view of functions consuming CPU
- dump Dumps stack traces for a target program to stdout
- help Print this message or the help of the given subcommand(s)
py-spy 基本功能
一般在命令行中运行py-spy,并对py-spy传入要分析的进程的PID或要运行的python程序。
py-spy具有三个子命令record,top和dump:
- record生成火焰图

- top实时查看每个函数运行时间并统计
- dump显示每个python线程的当前调用堆栈
使用py-spy调试MindSpore数据集加载
构造一个数据迭代很慢的场景
先上一个经典代码
test_dataset.py
- import mindspore.dataset as ds
- import numpy as np
- import time
- class DatasetGenerator:
- def __init__(self):
- pass
- def __getitem__(self, item):
- self.do_something()
- return (np.array([item]),)
- def do_something(self):
- cnt = 0
- for i in range(100000000):
- cnt += 1
- def __len__(self):
- return 50
- def test_generator_0():
- data1 = ds.GeneratorDataset(DatasetGenerator(), ["data"])
- start = time.time()
- for item in data1.create_dict_iterator(num_epochs=1, output_numpy=True):
- print("data time:", time.time() - start)
- start = time.time()
虽然这个用例比较简单,但是确实会看到迭代的时候出数据很慢,运行一下可以看到
- data time: 5.431891679763794
- data time: 5.6114866733551025
- data time: 5.38549542427063
- data time: 5.577831268310547
基本上5秒才读出一条数据,50条数据就是250秒!这才50条数据,如果10w条呢,这个读取时间难以接受。
那么究竟问题出现在哪里呢?(虽然明眼能看到do_something这个函数有点问题,但是我们现在假装不知道)
我们需要py-spy帮我们定位一下问题。
使用py-spy的top功能查看调用栈和时间占比
我们重新运行一下这个脚本
python test_dataset.py &
注意我们允许的时候加了
&使其可以在后台运行,同时返回一个pid,比如这样
我们得到了这个python的进程id 116079,有了这个pid之后,我们就可以利用py-spy给我们做实时分析了,接下来我们在命令行中输入
py-spy top --pid 116079
假如遇到这个提示
Permission Denied: Try running again with elevated permissions by going 'sudo env "PATH=$PATH" !!'重新在命令行输入这个即可
sudo env "PATH=$PATH" !!
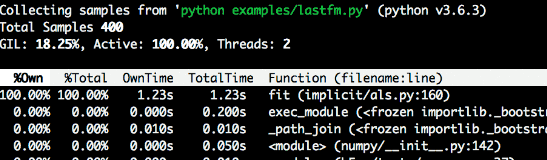
此时将会看到py-spy列出了调用栈及相关的函数用时占比:
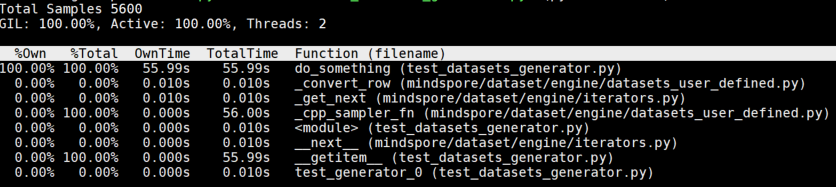
直观地从这个调用栈分析,do_something这个函数居然占用了100%的运行时间,运行超过了50+s,肯定有某些问题!或是处理逻辑太慢,或是写了死循环?
那么我们就可以快速来到代码的这里看看发生什么事了
- def do_something(self):
- cnt = 0
- for i in range(100000000):
- cnt += 1
天哪!这里居然有一个一亿次的循环加法,究竟是谁写的代码!(不是我) 我们可以通过优化这一部分代码,来提升整体数据处理的速度。
总的来说
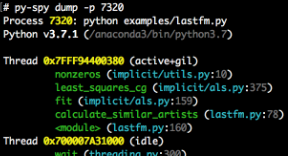
py-spy是一个挺方便的工具,帮助用户快速定位python的性能问题,除了top功能之外,py-spy也提供了dump功能把完整的堆栈写入到本地方便分析。当我们在 debug 一个线上正在运行的程序的时候,只需要提供进程id,py-spy就可以直接接入使用。
-
相关阅读:
2.14 PE结构:地址之间的转换
[计算机通信网络]关于ip地址、MAC地址、端口地址的抽象理解与实例
C练习题_14
数据可视化:视觉感知与基本图表
pdf如何压缩文件大小?pdf文件在线压缩方法介绍
MoveFunsDAO 星航计划|从Move入门Web3与深入实践「公益课堂」
基于SSM的住院病人监测预警信息管理系统毕业设计源码021054
基于Gazebo的无人机管道检测
为 AI 而生的编程语言「GitHub 热点速览」
卸载MySQL提示MySQL for Visual Studio 1.2.10时指定的用户已存在解决办法
- 原文地址:https://blog.csdn.net/Kenji_Shinji/article/details/126957274