-
使用redis-exporter对redis集群进行性能监控
redis集群有三种模式,主从,sentinel(哨兵),cluster。关于这三种模式的介绍和部署,其它文章也有相关介绍,本人参考了他人的博客完成了三种模式的部署,博客地址:https://blog.csdn.net/miss1181248983/article/details/90056960。非常感谢此大佬的分享
目前redis使用主从模式,集群信息如下:[root@master redis]# redis-cli -h 192.168.122.7 -a 123456 info replication Warning: Using a password with '-a' or '-u' option on the command line interface may not be safe. # Replication role:master connected_slaves:2 slave0:ip=192.168.122.8,port=6379,state=online,offset=28,lag=0 slave1:ip=192.168.122.9,port=6379,state=online,offset=28,lag=1 master_replid:950b3c2b60b56148577e566ac53af00911527c4e master_replid2:0000000000000000000000000000000000000000 master_repl_offset:28 second_repl_offset:-1 repl_backlog_active:1 repl_backlog_size:1048576 repl_backlog_first_byte_offset:1 repl_backlog_histlen:28 [root@master redis]# [root@master ~]#- 1
- 2
- 3
- 4
- 5
- 6
- 7
- 8
- 9
- 10
- 11
- 12
- 13
- 14
- 15
- 16
- 17
以上信息可以看出,此时集群为主从模式,192.168.122.7为master节点,192.168.122.8和192.168.122.9为slave节点。关于redis的具体操作这儿不做阐述,相关文章很多。下面步骤就是如何利用redis-exporter收集redis性能监控。
1 创建redis-exporter
使用下面的yaml文件创建一个redis-exporter的Deployment‘
[root@master redis-local]# cat redis-exporter.yaml apiVersion: apps/v1 kind: Deployment metadata: name: redis-exporter001 namespace: monitoring labels: k8s-app: redis-exporter001 spec: selector: matchLabels: k8s-app: redis-exporter001 template: metadata: labels: k8s-app: redis-exporter001 spec: containers: - name: redis-exporter001 image: oliver006/redis_exporter:latest args: ["-redis.addr", "redis://192.168.122.7:6379", "-redis.password", "123456"] ports: - containerPort: 9121 name: http [root@master redis-local]# kubectl apply -f redis-exporter.yaml deployment.apps/redis-exporter001 created [root@master redis-local]# kubectl logs -f -n monitoring redis-exporter001-5dc78569b5-5lmtf time="2020-05-26T02:49:21Z" level=info msg="Redis Metrics Exporter v1.6.1 build date: 2020-05-13-02:16:26 sha1: 34c779deb5f9a1e023166b5cf3717d53cdc97053 Go: go1.14.2 GOOS: linux GOARCH: amd64" time="2020-05-26T02:49:21Z" level=info msg="Providing metrics at :9121/metrics"- 1
- 2
- 3
- 4
- 5
- 6
- 7
- 8
- 9
- 10
- 11
- 12
- 13
- 14
- 15
- 16
- 17
- 18
- 19
- 20
- 21
- 22
- 23
- 24
- 25
- 26
- 27
- 28
- 29
此时redis-exporter创建完成
2 创建redis-exporter服务
使用下面的yaml文件创建redis-exporter服务
[root@master redis-local]# cat redis-exporter-service.yaml apiVersion: v1 kind: Service metadata: labels: k8s-app: redis-exporter001 name: redis-exporter001 namespace: monitoring spec: type: NodePort ports: - name: http port: 9121 nodePort: 30019 targetPort: http selector: k8s-app: redis-exporter001 [root@master redis-local]# kubectl apply -f redis-exporter-service.yaml service/redis-exporter001 created [root@master redis-local]# kubectl describe svc -n monitoring redis-exporter001 Name: redis-exporter001 Namespace: monitoring Labels: k8s-app=redis-exporter001 Annotations: kubectl.kubernetes.io/last-applied-configuration: {"apiVersion":"v1","kind":"Service","metadata":{"annotations":{},"labels":{"k8s-app":"redis-exporter001"},"name":"redis-exporter001","name... Selector: k8s-app=redis-exporter001 Type: NodePort IP: 10.10.126.113 Port: http 9121/TCP TargetPort: http/TCP NodePort: http 30019/TCP Endpoints: 10.124.187.225:9121 Session Affinity: None External Traffic Policy: Cluster Events:[root@master redis-local]# - 1
- 2
- 3
- 4
- 5
- 6
- 7
- 8
- 9
- 10
- 11
- 12
- 13
- 14
- 15
- 16
- 17
- 18
- 19
- 20
- 21
- 22
- 23
- 24
- 25
- 26
- 27
- 28
- 29
- 30
- 31
- 32
- 33
- 34
- 35
- 36
使用nodeip:nodeport进行访问
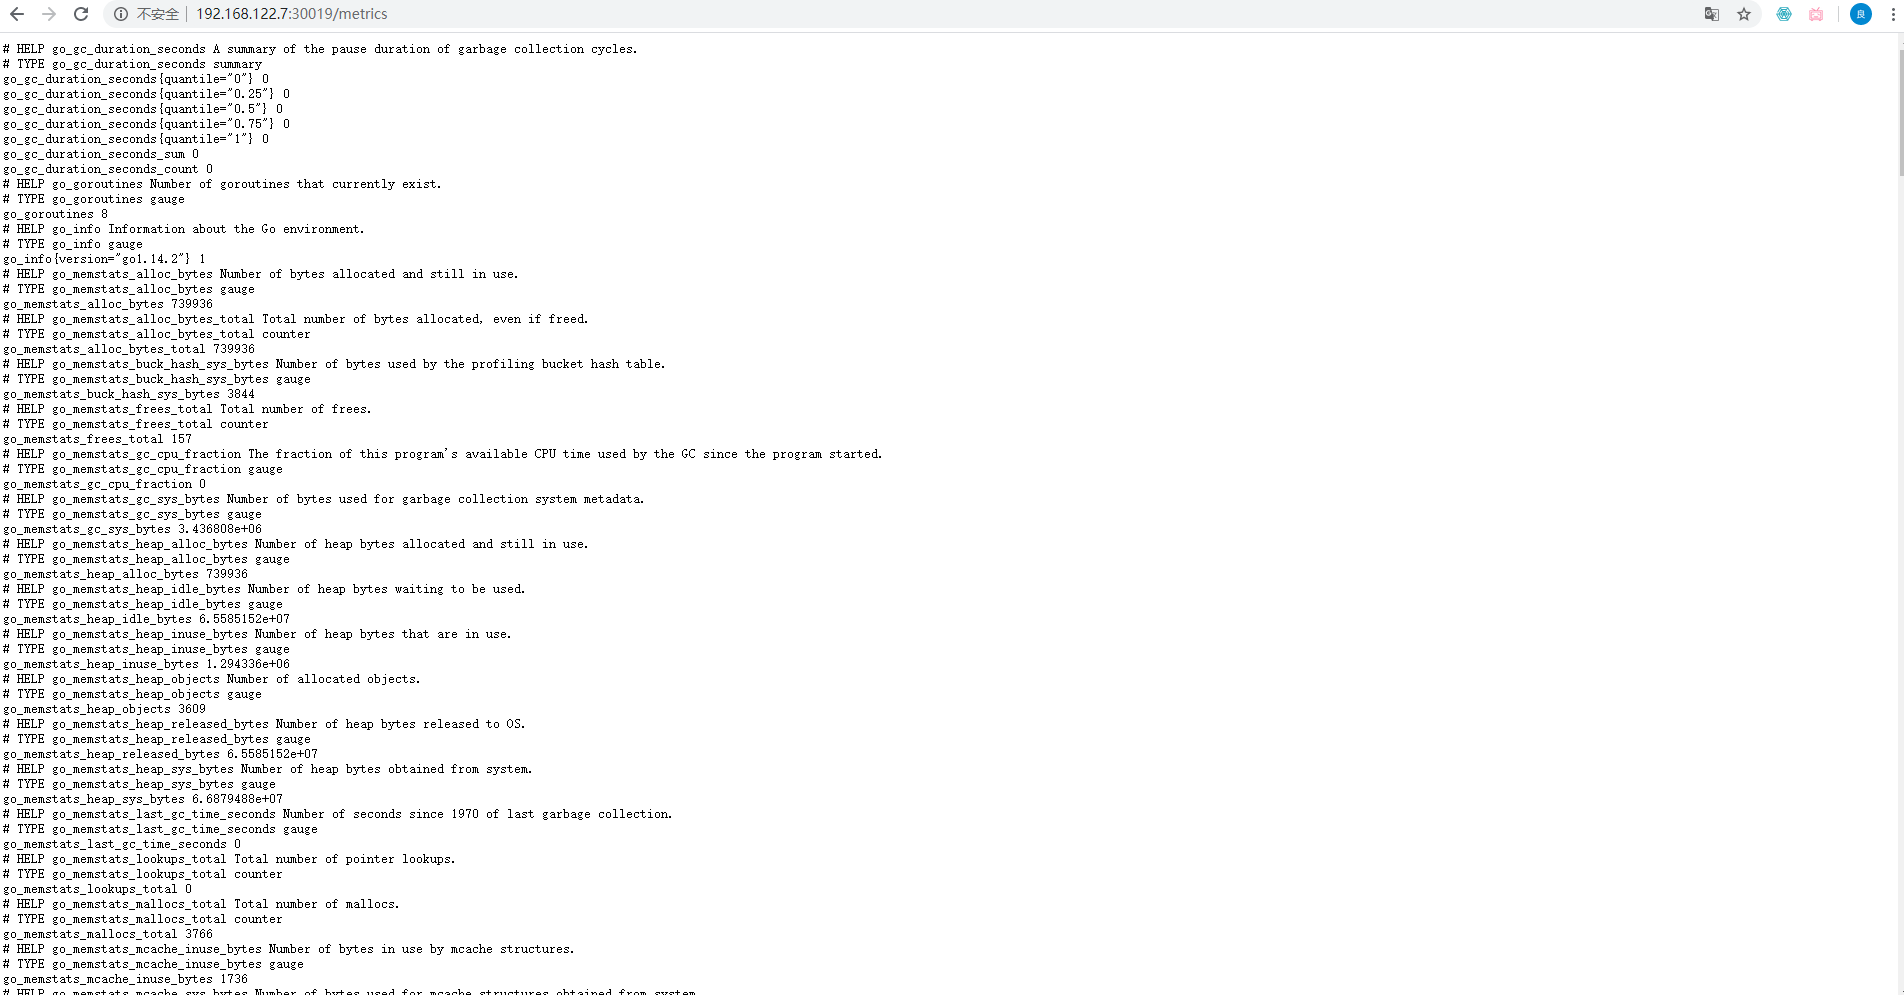
此时redis的metrics部署完成3创建redis-exporter-serverMonitor
使用下面的文件创建redis-exporter-serverMonitor
[root@master redis-local]# cat redis-exporter-serviceMonitor.yaml apiVersion: monitoring.coreos.com/v1 kind: ServiceMonitor metadata: labels: k8s-app: redis-exporter001 name: redis-exporter001 namespace: monitoring spec: endpoints: - interval: 30s port: http jobLabel: k8s-app selector: matchLabels: k8s-app: redis-exporter001 [root@master redis-local]# kubectl apply -f redis-exporter-serviceMonitor.yaml servicemonitor.monitoring.coreos.com/redis-exporter001 created [root@master redis-local]# kubectl describe servicemonitors.monitoring.coreos.com -n monitoring redis-exporter001 Name: redis-exporter001 Namespace: monitoring Labels: k8s-app=redis-exporter001 Annotations: kubectl.kubernetes.io/last-applied-configuration: {"apiVersion":"monitoring.coreos.com/v1","kind":"ServiceMonitor","metadata":{"annotations":{},"labels":{"k8s-app":"redis-exporter001"},"na... API Version: monitoring.coreos.com/v1 Kind: ServiceMonitor Metadata: Creation Timestamp: 2020-05-26T02:53:46Z Generation: 1 Resource Version: 574501 Self Link: /apis/monitoring.coreos.com/v1/namespaces/monitoring/servicemonitors/redis-exporter001 UID: 065dc9cc-a872-4630-a387-f4b11193aab6 Spec: Endpoints: Interval: 30s Port: http Job Label: k8s-app Selector: Match Labels: k8s-app: redis-exporter001 Events:- 1
- 2
- 3
- 4
- 5
- 6
- 7
- 8
- 9
- 10
- 11
- 12
- 13
- 14
- 15
- 16
- 17
- 18
- 19
- 20
- 21
- 22
- 23
- 24
- 25
- 26
- 27
- 28
- 29
- 30
- 31
- 32
- 33
- 34
- 35
- 36
- 37
- 38
- 39
- 40
- 41
最后创建一个serviceaccount
[root@master yaml]# kubectl create serviceaccount -n monitoring redis-exporter001 serviceaccount/redis-exporter001 created- 1
- 2
以上部署完成后,在prometheus页面中查看对应的targets

4 grafana面板创建dashboard来监控redis集群


点击Import

监控效果如上图5 redis写入数据进行测试
[root@master redis-local]# cat 123.txt |redis-cli -h 192.168.122.7 -a 123456- 1

批量插入数据 ,查看grafana监控

此时redis性能使用率已经在上升。
关于如何监控redis集群——主从模式到此完成。关于如何监控另外两种模式,后续文档会继续更新。 -
相关阅读:
SpringBoot之公共字段can‘t find referenced pointcut autoFillPointCut
Web基础—HTML基础学习(知识描述+例子)
数字信号处理FFT快速傅立叶变换MATLAB实现——实例
Java中常见锁的分类及概念分析
使用YOLOv5-C3模块识别图像天气 - P8
分享关于UE4中matinee工具的使用教程
GAMES101:作业2记录
Unity 使用StateMachineBehaviour让动画控制器状态自动关闭跳出
uni-app自定义导航栏
数学建模比赛心得
- 原文地址:https://blog.csdn.net/Bejpse/article/details/126564786