-
对比Excel,轻松学习Python数据分析》读书笔记------Pandas入门
Pandas入门
2 Python准备
2.1 Python
- 安装Python(下载地址)
- 熟悉Python基础语法
我的python学习笔记专栏
2.2 Jupyter Notebook
- 安装Anaconda(下载地址)
- 打开Anaconda Prompt,先后输入
pip install jupyter_contrib_nbextensions jupyter contrib nbextensions install --user- 1
- 2
- 3
安装插件管理模块

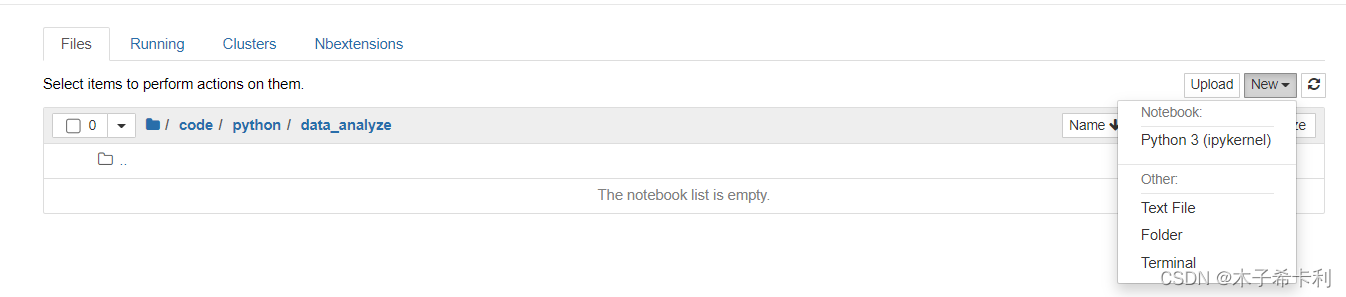
- 打开Jupyter Notebook,等待跳转服务器
- 安装"Tables of contents(2)"插件

- 新建文件
- 输入代码或markdown
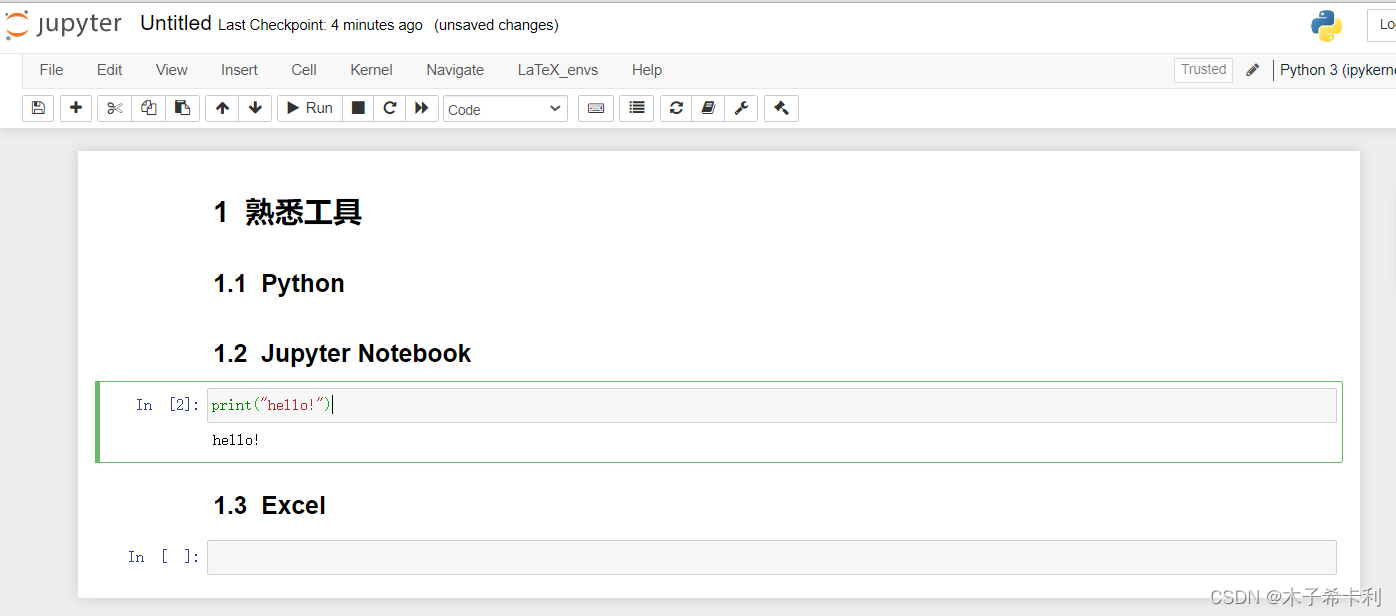
- 继续熟悉各项功能
- 查看和修改设置文件
打开Anaconda Prompt,输入
jupyter notebook --generate-config #获取系统配置文件目录- 1
进入对应文件夹找到配置文件目录,进入并修改
- 修改界面样式
"anoconda\Lib\site-packages\notebook\static\components\codemirror\lib\codemirror.css"- 1
3 Pandas 基本数据结构
3.0 导入Pandas
import pandas as pd- 1
3.1 Series对象
3.1.1 Series总览
Series是Pabdas中一种类似一维列表的对象。它由一个索引和一个数据组成。
在Excel中类似以下效果:

3.1.2 创建Series对象
pd.Series( data=None, index=None, dtype: 'Dtype | None' = None, name=None, copy: 'bool' = False, )- 1
- 2
- 3
- 4
- 5
- 6
- 7
data需要传入一个序列类型的对象(列表、元组、字典等)index可以传入一个由索引名组成的列表dtype可以设置数据类型name可以给Series对象设置一个别名copy设置是否复制data
常见的如:
names=pd.Series(["赵","钱","孙","李","孙","王","郑","王"]) #传入列表 print(names) #索引默认从0开始 """ 0 赵 1 钱 2 孙 3 李 4 孙 5 王 6 郑 7 王 dtype: object """ names=pd.Series(["赵","钱","孙","李","孙","王","郑","王"],[1,2,3,4,5,6,7,8]) #指定索引 print(names) """ 1 赵 2 钱 3 孙 4 李 5 孙 6 王 7 郑 8 王 dtype: object """ grades=pd.Series({"第一名":"张三","第二名":"李四","第三名":"王二麻子"}) #传入字典 print(grades) #key为索引,value为数据 """ 第一名 张三 第二名 李四 第三名 王二麻子 dtype: object """- 1
- 2
- 3
- 4
- 5
- 6
- 7
- 8
- 9
- 10
- 11
- 12
- 13
- 14
- 15
- 16
- 17
- 18
- 19
- 20
- 21
- 22
- 23
- 24
- 25
- 26
- 27
- 28
- 29
- 30
- 31
- 32
- 33
- 34
- 35
- 36
3.1.3 获取全部索引
series_obj.index- 1
- 获取
Series对象series_obj的全部索引。 - 返回
Index类型的对象
如:
names_index = names.index print(names_index) # Int64Index([1, 2, 3, 4, 5, 6, 7, 8], dtype='int64') grades_index = grades.index print(grades_index) # Index(['第一名', '第二名', '第三名'], dtype='object')- 1
- 2
- 3
- 4
- 5
- 6
- 7
3.1.4 获取全部数据
series_obj.values- 1
- 获取``Series
对象series_obj`的全部数据。 - 返回
numpy.ndarray类型的对象
如:
names_values = names.values print(names_values) # ['赵' '钱' '孙' '李' '孙' '王' '郑' '王'] grades_values = grades.values print(grades_values) # ['张三' '李四' '王二麻子']- 1
- 2
- 3
- 4
- 5
- 6
- 7
3.2 DataFrame对象
3.2.1 DataFrame总览
DataFrame是Pabdas中一种类似表格的对象。它由一对索引(行索引和列索引)和一组数据组成。
在Excel中类似以下效果:

3.2.2 创建DataFrame对象
pd.DataFrame( data=None, index: 'Axes | None' = None, columns: 'Axes | None' = None, dtype: 'Dtype | None' = None, copy: 'bool | None' = None, )- 1
- 2
- 3
- 4
- 5
- 6
- 7
data需要传入一个序列类型的对象(列表、元组、字典等),多为二维index设置行索引columns设置列索引dtype设置数据类型copy设置是否复制data
如:
df1=pd.DataFrame(["a","b","c","d"]) print(df1) #一维也会自动设置行列索引,从0开始 """ 0 0 a 1 b 2 c 3 d """ df2=pd.DataFrame([["a","A"],["b","B"],["c","C"],["d","D"]]) print(df2) # 二维列表,内层列表是每行 """ 0 1 0 a A 1 b B 2 c C 3 d D """ df3=pd.DataFrame([["a","A"],["b","B"],["c","C"],["d","D"]],index=[1,2,3,4],columns=["lower","upper"]) print(df3) # index设置行索引,columns设置列索引 """ lower upper 1 a A 2 b B 3 c C 4 d D """ df4=pd.DataFrame({"lower":["a","b","c","d"],"upper":["A","B","C","D"]},index=[1,2,3,4]) print(df4) # 字典的key是列索引,value是每列,行索引可以通过index另外设置 """ lower upper 1 a A 2 b B 3 c C 4 d D """- 1
- 2
- 3
- 4
- 5
- 6
- 7
- 8
- 9
- 10
- 11
- 12
- 13
- 14
- 15
- 16
- 17
- 18
- 19
- 20
- 21
- 22
- 23
- 24
- 25
- 26
- 27
- 28
- 29
- 30
- 31
- 32
- 33
- 34
- 35
- 36
- 37
- 38
- 39
3.2.3 获取行列索引
df_obj.index # 获取所有行索引 df_obj.columns # 获取所有列索引- 1
- 2
- 返回
Index类型的对象
如:
df4_index=df4.index print(df4_index) # Int64Index([1, 2, 3, 4], dtype='int64') df4_columns=df4.columns print(df4.columns) # Index(['lower', 'upper'], dtype='object')- 1
- 2
- 3
- 4
- 5
- 6
- 7
3.3.4 获取数据
第六章讨论
4 获取数据源
4.1 导入外部数据

4.1.1 导入xlsl文件
xlsl文件是Excel表格文件。对应Excel"来自文件"的"从Excel工作簿"
pd.read_excel( io, sheet_name: 'str | int | list[IntStrT] | None' = 0, header: 'int | Sequence[int] | None' = 0, names=None, index_col: 'int | Sequence[int] | None' = None, usecols=None, dtype: 'DtypeArg | None' = None, nrows: 'int | None' = None )- 1
- 2
- 3
- 4
- 5
- 6
- 7
- 8
- 9
- 10
io设置导入的xlsl文件的路径sheet_name设置需要导入的sheet,可以用sheet名字符串,也可以传入数字(从0开始),默认第一张。header设置使用哪一行作为列索引。默认以第一行作为列索引。可以传入数字(从0开始)。names设置列索引。先要设置header=None禁用表中的行作为列索引。可以传入列表来指定列索引。index_col设置使用哪一列来作为行索引。可以传入数字(从0开始)。usecols设置导入哪几列数据。可以传入数字组成的列表类数据(从0开始)。dtype设置每一列的数据类型。可以传入字典。key是列索引,value是数据类型。nrows设置显示前几行数据。- 返回一个
DataFrame对象
如:

grades_df=pd.read_excel("./files/学生成绩单.xlsx", sheet_name="第一学期期末成绩", index_col=1, usecols=[0,1,3,4,5,6,7,8,9], nrows=5) print(grades_df) """ 学号 语文 数学 英语 生物 地理 历史 政治 姓名 包宏伟 120305 91.5 89 94 92 91 86 86 陈万地 120203 93.0 99 92 86 86 73 92 杜学江 120104 102.0 116 113 78 88 86 73 符合 120301 99.0 98 101 95 91 95 78 吉祥 120306 101.0 94 99 90 87 95 93 """- 1
- 2
- 3
- 4
- 5
- 6
- 7
- 8
- 9
- 10
- 11
- 12
- 13
- 14
- 15
4.1.2 导入CSV文件
逗号分隔值(Comma-Separated Values,CSV,有时也称为字符分隔值,因为分隔字符也可以不是逗号),其文件以纯文本形式存储表格数据。
pd.read_csv( filepath_or_buffer: 'FilePath | ReadCsvBuffer[bytes] | ReadCsvBuffer[str]', delimiter=None, header='infer', names=<no_default>, index_col=None, usecols=None, dtype: 'DtypeArg | None' = None, engine: 'CSVEngine | None' = None, nrows=None, encoding=None, )- 1
- 2
- 3
- 4
- 5
- 6
- 7
- 8
- 9
- 10
- 11
- 12
filepath_or_buffer设置csv文件路径delimiter设置数据间的分隔符(默认为逗号)header、names、index_col、usecols、dtype、nrows同read_excel()方法engine指定解析引擎,路径中有中文时,可尝试传入engine=pythonencoding指定csv编码格式,常见的有gbk或utf-8- 返回一个
DataFrame对象
如:

grades_df=pd.read_csv("./files/学生成绩单.CSV", index_col=1, engine="python", usecols=[0,1,3,4,5,6,7,8,9], nrows=5, encoding="gbk" ) print(grades_df) """ 学号 语文 数学 英语 生物 地理 历史 政治 姓名 包宏伟 120305 91.5 89 94 92 91 86 86 陈万地 120203 93.0 99 92 86 86 73 92 杜学江 120104 102.0 116 113 78 88 86 73 符合 120301 99.0 98 101 95 91 95 78 吉祥 120306 101.0 94 99 90 87 95 93 """- 1
- 2
- 3
- 4
- 5
- 6
- 7
- 8
- 9
- 10
- 11
- 12
- 13
- 14
- 15
- 16
- 17
4.1.3 导入txt文件
txt文件就是普通的文本文件
pd.read_table( filepath_or_buffer: 'FilePath | ReadCsvBuffer[bytes] | ReadCsvBuffer[str]', delimiter=None, header='infer', names=<no_default>, index_col=None, usecols=None, dtype: 'DtypeArg | None' = None, engine: 'CSVEngine | None' = None, nrows=None, encoding=None, )- 1
- 2
- 3
- 4
- 5
- 6
- 7
- 8
- 9
- 10
- 11
- 12
同
read_csv,只不过delimiter没有默认值,需要用户指定。返回一个
DataFrame对象也可以读取csv文件。
rades_df=pd.read_csv("./files/学生成绩单.txt", delimiter=",", index_col=1, engine="python", usecols=[0,1,3,4,5,6,7,8,9], nrows=5, encoding="gbk") print(grades_df) """ 学号 语文 数学 英语 生物 地理 历史 政治 姓名 包宏伟 120305 91.5 89 94 92 91 86 86 陈万地 120203 93.0 99 92 86 86 73 92 杜学江 120104 102.0 116 113 78 88 86 73 符合 120301 99.0 98 101 95 91 95 78 吉祥 120306 101.0 94 99 90 87 95 93 """- 1
- 2
- 3
- 4
- 5
- 6
- 7
- 8
- 9
- 10
- 11
- 12
- 13
- 14
- 15
- 16
- 17
4.1.4 导入mysql文件
使用
pymysql模块连接数据库并导入数据表import pymysql con=pymysql.connect(host="localhost", port=3306, user="root", password="123", database="pdd", charset="utf8") pd.read_sql(sql, con, index_col: 'str | Sequence[str] | None' = None, columns=None)- 1
- 2
- 3
- 4
- 5
- 6
- 7
- 8
- 9
- 10
- 11
- 12
-
sql为SQL语句,con是与数据库建立的连接对象 -
index_col指定作为行索引的列。 -
返回一个
DataFrame对象
如:

import pymysql con=pymysql.connect(host="localhost", port=3306, user="root", password="123", database="pdd", charset="utf8") goods=pd.read_sql("select id,name,price from goods;",con,index_col="id") print(goods) """ name price id 1 2022解题达人数学选择填空题 7.92 2 C Primer Plus中文第6版 53.80 3 大型单机电脑合集 100.00 4 2022五年高考三年模拟数学 18.80 5 夏季女装 29.90 """- 1
- 2
- 3
- 4
- 5
- 6
- 7
- 8
- 9
- 10
- 11
- 12
- 13
- 14
- 15
- 16
- 17
- 18
- 19
4.2 新建数据
主要通过
pd.DataFrame创建。4.3 熟悉数据
4.3.1 预览前几行
Excel
Excel会直接把所有数据显示。
Python
df_obj.head(n)- 1
n代表显示前n行
如:
print(goods.head(5)) """ name price id 1 2022解题达人数学选择填空题 7.92 2 C Primer Plus中文第6版 53.80 3 大型单机电脑合集 100.00 4 2022五年高考三年模拟数学 18.80 5 夏季女装 29.90 """ print(goods.head(3)) """ name price id 1 2022解题达人数学选择填空题 7.92 2 C Primer Plus中文第6版 53.80 3 大型单机电脑合集 100.00 """- 1
- 2
- 3
- 4
- 5
- 6
- 7
- 8
- 9
- 10
- 11
- 12
- 13
- 14
- 15
- 16
- 17
- 18
- 19
4.3.2 获取数据表的大小
Excel
选中某行看列数,选中某列看列数,选中某区域看个数。
- 包含索引


Python
df_obj.shape- 1
- 以元组形式返回行数和列数
- 不包含索引
如:
grades_df = pd.read_excel("./files/学生成绩单.xlsx", sheet_name="第一学期期末成绩", index_col=1) print(grades_df) """ 学号 班级 语文 数学 英语 生物 地理 历史 政治 总分 平均分 姓名 包宏伟 120305 NaN 91.5 89 94 92 91 86 86 NaN NaN 陈万地 120203 NaN 93.0 99 92 86 86 73 92 NaN NaN 杜学江 120104 NaN 102.0 116 113 78 88 86 73 NaN NaN 符合 120301 NaN 99.0 98 101 95 91 95 78 NaN NaN 吉祥 120306 NaN 101.0 94 99 90 87 95 93 NaN NaN 李北大 120206 NaN 100.5 103 104 88 89 78 90 NaN NaN 李娜娜 120302 NaN 78.0 95 94 82 90 93 84 NaN NaN 刘康锋 120204 NaN 95.5 92 96 84 95 91 92 NaN NaN 刘鹏举 120201 NaN 93.5 107 96 100 93 92 93 NaN NaN 倪冬声 120304 NaN 95.0 97 102 93 95 92 88 NaN NaN 齐飞扬 120103 NaN 95.0 85 99 98 92 92 88 NaN NaN 苏解放 120105 NaN 88.0 98 101 89 73 95 91 NaN NaN 孙玉敏 120202 NaN 86.0 107 89 88 92 88 89 NaN NaN 王清华 120205 NaN 103.5 105 105 93 93 90 86 NaN NaN 谢如康 120102 NaN 110.0 95 98 99 93 93 92 NaN NaN 闫朝霞 120303 NaN 84.0 100 97 87 78 89 93 NaN NaN 曾令煊 120101 NaN 97.5 106 108 98 99 99 96 NaN NaN 张桂花 120106 NaN 90.0 111 116 72 95 93 95 NaN NaN """ print(grades_df.shape) # (18, 11)- 1
- 2
- 3
- 4
- 5
- 6
- 7
- 8
- 9
- 10
- 11
- 12
- 13
- 14
- 15
- 16
- 17
- 18
- 19
- 20
- 21
- 22
- 23
- 24
- 25
- 26
- 27
- 28
4.3.4 查看字段的数据类型
Excel
选中想要查看的数据列,在"数字"栏查看。

Python
df_obj.info()- 1
- 显示
df_obj的基本信息,如行索引Index,列索引Data volumns,每列的非空值个数和数据类型
如:
grades_df.info() """Index: 18 entries, 包宏伟 to 张桂花 Data columns (total 11 columns): # Column Non-Null Count Dtype --- ------ -------------- ----- 0 学号 18 non-null int64 1 班级 0 non-null float64 2 语文 18 non-null float64 3 数学 18 non-null int64 4 英语 18 non-null int64 5 生物 18 non-null int64 6 地理 18 non-null int64 7 历史 18 non-null int64 8 政治 18 non-null int64 9 总分 0 non-null float64 10 平均分 0 non-null float64 dtypes: float64(4), int64(7) memory usage: 1.7+ KB """ - 1
- 2
- 3
- 4
- 5
- 6
- 7
- 8
- 9
- 10
- 11
- 12
- 13
- 14
- 15
- 16
- 17
- 18
- 19
- 20
- 21
4.3.5 查看基本的数值分布
Excel
选中某一列,可以看到数据的平均值、总个数、和

Python
df_obj.describe()- 1
- 显示
df_obj的各列的信息。如总个数(count),平均值(count),标准差(std),最小值(min),下四分位数(25%),中位数(50%),上四分位数(75%),最大值(max)
如:
grades_df.describe() """ 学号 班级 语文 数学 英语 生物 \ count 18.000000 0.0 18.000000 18.000000 18.000000 18.000000 mean 120203.500000 NaN 94.611111 99.833333 100.222222 89.555556 std 84.035182 NaN 7.729918 7.890799 7.025630 7.492916 min 120101.000000 NaN 78.000000 85.000000 89.000000 72.000000 25% 120105.250000 NaN 90.375000 95.000000 96.000000 86.250000 50% 120203.500000 NaN 95.000000 98.500000 99.000000 89.500000 75% 120301.750000 NaN 100.125000 105.750000 103.500000 94.500000 max 120306.000000 NaN 110.000000 116.000000 116.000000 100.000000 地理 历史 政治 总分 平均分 count 18.000000 18.000000 18.000000 0.0 0.0 mean 90.000000 90.000000 88.833333 NaN NaN std 6.211943 6.259111 5.873670 NaN NaN min 73.000000 73.000000 73.000000 NaN NaN 25% 88.250000 88.250000 86.500000 NaN NaN 50% 91.500000 92.000000 90.500000 NaN NaN 75% 93.000000 93.000000 92.750000 NaN NaN max 99.000000 99.000000 96.000000 NaN NaN """- 1
- 2
- 3
- 4
- 5
- 6
- 7
- 8
- 9
- 10
- 11
- 12
- 13
- 14
- 15
- 16
- 17
- 18
- 19
- 20
- 21
- 22
-
相关阅读:
PL/SQL 面向对象
ansible-copy用法
纷享销客《2022新增长系列之快消行业橙皮书》重磅发布
力扣刷题篇之数与位2
python判断字符串是否全为空字符——isspace函数的用法及实例
常用linux的命令(持续更新)
进销存软件哪个好?
chrome插件-Web开发者助手 FeHelper
R语言——taxize(第四部分)
2022年最新广西建筑八大员(土建质量员)考试试题题库及答案
- 原文地址:https://blog.csdn.net/ncu5509121083/article/details/126075244
