-
Paddle CrowdNet 人群密度估计
Paddle CrowdNet 人群密度估计
导语
官方代码链接在最后
人群计数方法:
- 基于目标检测
- 基于回归
基于回归:
- 直接回归:在深度学习的卷积神经网络中输入人群图像,直接输出一个人群数目估计值,(这种通常是根据边缘纹理来回归分类的)
- 密度图回归:在已知的数据集中,每一张人群图像中的每个人头所在近似中心位置的坐标作为人工标注,根据已知的每个人头位置,再估计该位置所在人头的大小,这样可以得到该人头的覆盖区域,通过一种方法(MCNN中采用几何自适应高斯核),将该区域转化为该区域内可能为人头的概率,该区域概率和为1(或者表示每个像素可能有多少个人),最终我们可以得到一张人群密度图
密度图表示经过两个步骤:人群图像标注表示,人群图像标注转换为人群密度图
要做人群密度估计,就需要得到一些人群图像的标注文件,那如何标注呢

如上图就是一个标注的人群图像,19*19大小方格表示人群图像(绿色外层方格表示坐标),该图像包含3个人,以左上角为坐标原点,坐标(3, 6), (12, 9), (17, 15)表示标注的人头中心点位置(在图1中表示为方格对应坐标的值为1)密度图
假设在图像中每个人头大小都是3*3像素(当然这只是示例假设,MCNN中用几何自适应高斯核来估计图像中每个人头的大小并转换为密度图

如何制作crowd 数据集
这里写一个自动化的脚本,通过拍摄的图像或者视频(切分成帧),将一张一张图像进行展示,我们可以在图像中进行人头标点,程序会记录下这些坐标点(x,y),根据每张图像的坐标点,生成对应.mat文件,在模型训练时,将文件转化为密度图(density map)
制作Crowd数据集
对视频,切分成图像
cv2读取为BGR图像,plt读取图像为RGB图像
import cv2 import numpy as np from matplotlib import pyplot as plt import os %matplotlib inline # 导入一些可视化需要的包 import imageio import matplotlib.animation as animation from IPython.display import HTML import warnings warnings.filterwarnings("ignore") from tqdm import tqdm filename='Pictures/yihua.jpg' img1 = cv2.imread(filename) plt.imshow(img1) img2=cv2.cvtColor(img1,cv2.COLOR_BGR2RGB) plt.imshow(img2)- 1
- 2
- 3
- 4
- 5
- 6
- 7
- 8
- 9
- 10
- 11
- 12
- 13
- 14
- 15
- 16
- 17
- 18
- 19


我们的图片坐标轴如下图所示,与常规的坐标系相反

将图片合成视频
def merge_video(img,num,img_path,video_name,fps): #合成视频,要求每一张图片尺寸要一样的,先获取一张图片的尺寸 img_info=img.shape height=img_info[0] width=img_info[1] size=(width,height) #写入视频 video=cv2.VideoWriter(video_name,cv2.VideoWriter_fourcc('m','p','4','v'), fps, size) #.mp4 ''' cv2.VideoWriter(参数1,参数2) 参数1,视频保存文件路径 参数2,视频编码器 fourcc意为四字符代码(Four-Character Codes),顾名思义,该编码由四个字符组成,下面是VideoWriter_fourcc对象一些常用的参数,注意:字符顺序不能弄混 cv2.VideoWriter_fourcc('I', '4', '2', '0'),该参数是YUV编码类型,文件名后缀为.avi cv2.VideoWriter_fourcc('P', 'I', 'M', 'I'),该参数是MPEG-1编码类型,文件名后缀为.avi cv2.VideoWriter_fourcc('X', 'V', 'I', 'D'),该参数是MPEG-4编码类型,文件名后缀为.avi cv2.VideoWriter_fourcc('T', 'H', 'E', 'O'),该参数是Ogg Vorbis,文件名后缀为.ogv cv2.VideoWriter_fourcc('F', 'L', 'V', '1'),该参数是Flash视频,文件名后缀为.flv cv2.VideoWriter_fourcc('m', 'p', '4', 'v') 文件名后缀为.mp4 参数3 为帧播放速率 参数4 (width,height)为视频帧大小 ''' path={} img_path=photo_path img_list=sorted(os.listdir(img_path)) img_nums=len(img_list) for i in range(img_nums): path[i]=img_path+img_list[i] value_list=list(path.values()) for i in tqdm(range(len(value_list))) item=value_list[i] img=cv2.imread(item) video.write(img) if i>num: break video.release() cv2.destroyAllWindows() def main(): filename='sanshangyouya1.jpg' img=cv2.imread(filename) photo_path='img/' video_name='sanshangyouya.mp4' fps=30 num=200 getvideo(img,num,photo_path,video_name,fps) if __name__=='__main__': main()- 1
- 2
- 3
- 4
- 5
- 6
- 7
- 8
- 9
- 10
- 11
- 12
- 13
- 14
- 15
- 16
- 17
- 18
- 19
- 20
- 21
- 22
- 23
- 24
- 25
- 26
- 27
- 28
- 29
- 30
- 31
- 32
- 33
- 34
- 35
- 36
- 37
- 38
- 39
- 40
- 41
- 42
- 43
- 44
- 45
- 46
- 47
- 48
- 49
- 50
将视频切分成图片
import imageio import os filename='抖音.mp4' vid = imageio.get_reader(filename,'ffmpeg') if not os.path.exists('output/'): os.mkdir('output/') try: for num,im in enumerate(vid): if (num / 50) and (num % 50) ==0: #自己根据条件选择不同的图片张数 imageio.imwrite('output/{}.jpg'.format(num),im) else: continue except RuntimeError: pass- 1
- 2
- 3
- 4
- 5
- 6
- 7
- 8
- 9
- 10
- 11
- 12
- 13
- 14
- 15
- 16
在图片上进行标注
import cv2 import os """ This code is used to: 1)对图片进行标注 2)生成对应的包含坐标信息的.txt文件 """ imgs_path = "output/" # 存放图像的文件夹 txt_path = "output/" # 存放txt文件的文件夹 files = os.listdir(imgs_path) img = 0 coordinates = [] def on_EVENT_LBUTTONDOWN(event, x, y, flags, param): if event == cv2.EVENT_LBUTTONDOWN: cv2.circle(img, (x, y), 4, (0, 255, 0), thickness=-1) coordinates.append([x, y]) print([x,y]) cv2.imshow("image", img) for file in files: # for i in range(80, len(files)): coordinates = [] img = cv2.imread(imgs_path+file) cv2.namedWindow("image") cv2.setMouseCallback("image", on_EVENT_LBUTTONDOWN) cv2.imshow("image", img) cv2.waitKey(0) with open(txt_path+file.replace("jpg","txt"), "w+") as f: for coor in coordinates: f.write(str(coor[0])+" "+str(coor[1])+"\n") # 记录每个人头的坐标点 f.write(str(len(coordinates))) # 记录一张图像中的人头总数 print(file+" is ok !"+"\n")- 1
- 2
- 3
- 4
- 5
- 6
- 7
- 8
- 9
- 10
- 11
- 12
- 13
- 14
- 15
- 16
- 17
- 18
- 19
- 20
- 21
- 22
- 23
- 24
- 25
- 26
- 27
- 28
- 29
- 30
- 31
- 32
- 33
- 34
- 35
mac有一个很恶心的地方,cv2.imshow,无法通过鼠标去关闭展示的那个图片,在mac上很难循环实施,可能需要写一个GUI程序。

将txt文件转位mat文件
import numpy as np import scipy.io as io import os txt_path = "output/txt/" #保存txt文件夹 save_path = "output/mat/" #保存mat文件夹 files = os.listdir(txt_path) for file in files: print(file) with open(txt_path+file, "r") as f: datas = f.readlines() list = [] for i in range(0, len(datas) - 1): line = datas[i].strip('\n') ele = line.split( ) list.append(ele) data_length = np.array([[datas[len(datas) - 1]]], dtype=np.uint8) data = np.array(list, dtype=np.float64) dt = np.dtype([('location', np.ndarray), ('number', np.ndarray)]) data_combine = np.array([(data, data_length)], dtype=dt) image_info = np.array([data_combine], dtype=[('location', 'O'),('number', 'O')]) # [[(data, data_length)]] image_info = np.array([[image_info]], dtype=object) __header__ = b'MATLAB 5.0 MAT-file Platform: nt, Created on: 2021' __version__ = '1.0' __globals__ = '[]' dict = {'__header__': __header__, '__version__': __version__, '__globals__': __globals__, 'image_info':image_info} gt = dict["image_info"][0,0][0,0][0] io.savemat(save_path+file.replace("txt","mat"), dict)- 1
- 2
- 3
- 4
- 5
- 6
- 7
- 8
- 9
- 10
- 11
- 12
- 13
- 14
- 15
- 16
- 17
- 18
- 19
- 20
- 21
- 22
- 23
- 24
- 25
- 26
- 27
- 28
- 29
- 30
- 31
- 32
- 33
- 34
Paddle实现
这里下载,网上的数据集
人流密度数据集CrowdNet网络实现训练

将数据集加入到data
- 把
train.json文件存放在data目录 - 把
test_new.zip解压到data目录 - 把
train_new.zip解压到data目录

create_list.py
import json import cv2 import numpy as np # 原标注文件 annotation_file = 'data/train.json' # 图像数据列表 data_list_file = 'data/data_list.txt' # 把图片对应的标签装入字典 f = open(annotation_file, encoding='utf-8') content = json.load(f) f_list = open(data_list_file, 'w', encoding='utf-8') # 图像路径替换 for j in range(len(content['annotations'])): content['annotations'][j]['name'] = content['annotations'][j]['name'].replace('stage1', 'data') # 获取标注的xy def get_xy(ann): gt = [] for b_l in range(len(ann)): if 'w' in ann[b_l].keys(): # 框转点 x = (ann[b_l]['x'] + (ann[b_l]['x'] + ann[b_l]['w'])) / 2 y = ann[b_l]['y'] + 20 gt.append((x, y)) else: x = ann[b_l]['x'] y = ann[b_l]['y'] gt.append((x, y)) return gt for ig_index in range(len(content['annotations'])): if len(content['annotations'][ig_index]['annotation']) == 2: continue if len(content['annotations'][ig_index]['annotation']) == 3: continue if len(content['annotations'][ig_index]['ignore_region']) == 2: continue if content['annotations'][ig_index]['name'] == 'train/8538edb45aaf7df78336aa5b49001be6.jpg': continue if content['annotations'][ig_index]['name'] == 'train/377df0a7a9abc44e840e938521df3b54.jpg': continue # 判断是否存在忽略区 if content['annotations'][ig_index]['ignore_region']: ig_list = [] # 忽略区为一个 if len(content['annotations'][ig_index]['ignore_region']) == 1: ign_rge = content['annotations'][ig_index]['ignore_region'][0] for ig_len in range(len(ign_rge)): ig_list.append([ign_rge[ig_len]['x'], ign_rge[ig_len]['y']]) img_path = content['annotations'][ig_index]['name'] # 将忽略涂白色 ig_cv_img = cv2.imread(img_path) pts = np.array(ig_list, np.int32) cv2.fillPoly(ig_cv_img, [pts], (0, 0, 0), cv2.LINE_AA) cv2.imwrite(img_path, ig_cv_img) annotation = content['annotations'][ig_index]['annotation'] gt = get_xy(annotation) f_list.write('%s\t%s\n' % (img_path, gt)) else: img_path = content['annotations'][ig_index]['name'] annotation = content['annotations'][ig_index]['annotation'] gt = get_xy(annotation) f_list.write('%s\t%s\n' % (img_path, gt))- 1
- 2
- 3
- 4
- 5
- 6
- 7
- 8
- 9
- 10
- 11
- 12
- 13
- 14
- 15
- 16
- 17
- 18
- 19
- 20
- 21
- 22
- 23
- 24
- 25
- 26
- 27
- 28
- 29
- 30
- 31
- 32
- 33
- 34
- 35
- 36
- 37
- 38
- 39
- 40
- 41
- 42
- 43
- 44
- 45
- 46
- 47
- 48
- 49
- 50
- 51
- 52
- 53
- 54
- 55
- 56
- 57
- 58
- 59
- 60
- 61
- 62
- 63
- 64
- 65
本项目提供了一个脚本
create_list.py可以把百度公开的数据集数据标准文件生成本项目所需要的标注格式,通过执行脚本可以生成类似以下格式的数据列表,每一行的前面是图像路径,后面的是人的坐标点,中间用制表符\t分开。如果开发者要训练自己的数据集,将图像标注数据生成以下格式即可。将标注的数据,生成以下格式(跟目标检测格式差不多)
data/train/4c93da45f7dc854a31a4f75b1ee30056.jpg [(171, 200), (365, 144), (306, 155), (451, 204), (436, 252), (600, 235)] data/train/3a8c1ed636145f23e2c5eafce3863bb2.jpg [(788, 205), (408, 250), (115, 233), (160, 261), (226, 225), (329, 161)] data/train/075ed038030094f43f5e7b902d41d223.jpg [(892, 646), (826, 763), (845, 75), (896, 260), (773, 752)]- 1
- 2
- 3
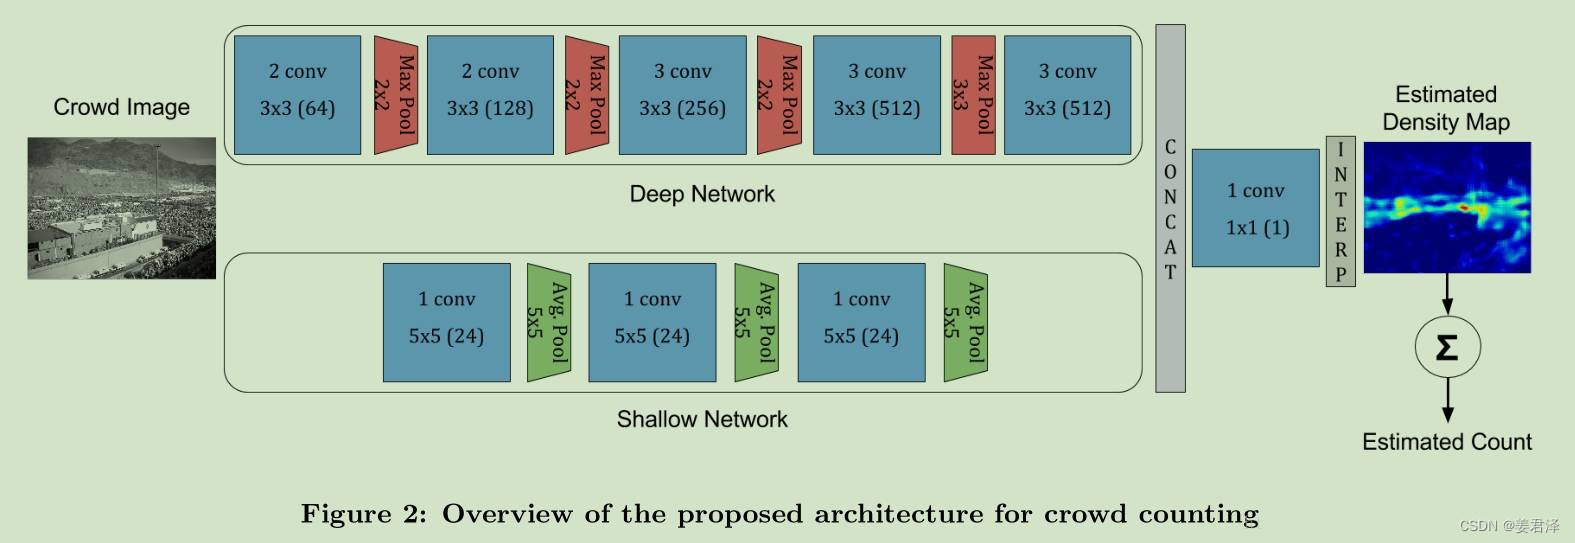
大白话(网络通过浅层卷积网络和高层卷积网络),浅层相当于提取于图像中远的人头坐标周围的特征,高层相当于提取出近的人头坐标的特征,通过周围特征与人头特征相结合,通过每个像素点人头的概率,来呈现出密度图。(概率高的,颜色越深,概率低的颜色越浅,就有了密度感)卷积越浅获取的特征越宏观,卷积越深,获取的特征越细节
原版是paddle1.8 fluid
model.pyimport paddle from paddle import ParamAttr import paddle.nn.initializer.KaimingNormal as MSRA from paddle.nn import Conv2D import paddle.nn.functional as F def conv(in_channels,out_channels,kernel_size,stride=1,padding,groups=1,act='relu'): parameter_attr=ParamAttr(learning_rate=0.1,initializer=MSRA()) conv = nn.Conv2D(in_channels=in_channels, out_channels=out_channels, kernel_size=kernel_size, stride=stride, padding=padding, groups=groups, weight_attr=parameter_attr, bias_attr=None) return nn.BatchNorm(num_channels=conv,act=act) def deep_network(img): x=img x=conv(in_channels=x,out_channels=64,kernel_size=3,padding=1,act='relu') x=conv(in_channels=x,out_channels=64,kernel_size=3,padding=1,act='relu') x=F.max_pool2d(x,kernel_size=2,stride=2) x=F.dropout(x,p=0.25) x=conv(in_channels=x,out_channels=128,kernel_size=3,padding=1,act='relu') x=conv(in_channels=x,out_channels=128,kernel_size=3,padding=1,act='relu') x=F.max_pool2d(x,kernel_size=2,stride=2) x=F.dropout(x,p=0.25) x=conv(in_channels=x,out_channels=256,kernel_size=3,padding=1,act='relu') x=conv(in_channels=x,out_channels=256,kernel_size=3,padding=1,act='relu') x=F.max_pool2d(x,kernel_size=2,stride=2) x=F.dropout(x,p=0.5) x=conv(in_channels=x,out_channels=512,kernel_size=3,padding=1,act='relu') x=conv(in_channels=x,out_channels=512,kernel_size=3,padding=1,act='relu') x=F.max_pool2d(x,kernel_size=3,padding=1,stride=1) x=conv(in_channels=x,out_channels=512,kernel_size=3,padding=1,act='relu') x=conv(in_channels=x,out_channels=512,kernel_size=3,padding=1,act='relu') x=conv(in_channels=x,out_channels=512,kernel_size=3,padding=1) x=F.dropout(x,p=0.5) return x def shallow_network(img): x=img x=conv(in_channels=x,out_channels=24,kernel_size=5,padding=3,act='relu') x=F.AvgPool2D(x,kernel_size=5,stride=2) x=conv(in_channels=x,out_channels=24,kernel_size=5,padding=3,act='relu') x=F.AvgPool2D(x,kernel_size=5,stride=2) x=conv(in_channels=x,out_channels=24,kernel_size=5,padding=4,act='relu') x=F.AvgPool2D(x,kernel_size=5,stride=2) return x net_out1 = deep_network(images) net_out2 = shallow_network(images) concat_out = paddle.concat(x=net_out1, net_out2], axis=1) conv_end = nn.conv2din_channels=concat_out, out_channels=1, kernel_sizee=1) # 双向性插值 map_out = F.upsample(conv_end, size=(80, 60),mode='bilinear')- 1
- 2
- 3
- 4
- 5
- 6
- 7
- 8
- 9
- 10
- 11
- 12
- 13
- 14
- 15
- 16
- 17
- 18
- 19
- 20
- 21
- 22
- 23
- 24
- 25
- 26
- 27
- 28
- 29
- 30
- 31
- 32
- 33
- 34
- 35
- 36
- 37
- 38
- 39
- 40
- 41
- 42
- 43
- 44
- 45
- 46
- 47
- 48
- 49
- 50
- 51
- 52
- 53
- 54
- 55
- 56
- 57
- 58
- 59
- 60
- 61
- 62
- 63
- 64
- 65
- 66
- 67
- 68
-
相关阅读:
Java毕业设计-火车订票管理系统
【Linux】VMware
DFS搜索和输出所有路径
上半年收入超耐克中国、大于两个李宁,安踏领跑背后的韧性
DataTableResponseEntity
操作系统知识
Leetcode之第299场周赛小记
计算机毕业设计(附源码)python影城在线售票及票房数据分析系统
vue路由(十一)vue路由: 判断是否登录,未登录跳转到登录页
36李沐动手学深度学习v2/图像增广
- 原文地址:https://blog.csdn.net/weixin_42010722/article/details/125736433
