-
WPF 常用功能整合
目录
WPF 解决 LiveCharts 中 Labels 显示不全的问题
WPF入门-1 行和列
微软官方资料:点击跳转
划分模块
有web前端开发经验的都知道,在做界面之前,通常会把界面分为几大的模块,然后再细化模块内部的界面布局,所以,学习WPF之前,也必须先弄懂这个
前端代码
- <Window x:Class="WpfApplication1.MainWindow"
- xmlns="http://schemas.microsoft.com/winfx/2006/xaml/presentation"
- xmlns:x="http://schemas.microsoft.com/winfx/2006/xaml"
- Title="MainWindow" Height="350" Width="800" Loaded="Window_Loaded">
- <Grid>
- <Grid.RowDefinitions>
- <RowDefinition Height="50"/>
- <RowDefinition Height="50"/>
- <RowDefinition Height="50"/>
- <RowDefinition Height="50"/>
- <RowDefinition Height="*"/>
- Grid.RowDefinitions>
- <Grid Grid.Row="0" Background="AntiqueWhite">
- Grid>
- <Grid Grid.Row="1" Background="Aqua">
- <Grid.ColumnDefinitions>
- <ColumnDefinition Width="300"/>
- <ColumnDefinition Width="300"/>
- Grid.ColumnDefinitions>
- <Grid Grid.Column="0" Background="BlueViolet">
- Grid>
- <Grid Grid.Column="1" Background="CadetBlue">
- Grid>
- Grid>
- <Grid Grid.Row="2" Background="Aquamarine">
- <Grid.ColumnDefinitions>
- <ColumnDefinition Width="300"/>
- <ColumnDefinition Width="300"/>
- Grid.ColumnDefinitions>
- Grid>
- <Grid Grid.Row="3" Background="Bisque">
- <Grid.ColumnDefinitions>
- <ColumnDefinition Width="300"/>
- <ColumnDefinition Width="300"/>
- Grid.ColumnDefinitions>
- Grid>
- <Grid Grid.Row="4" Background="Blue">
- Grid>
- Grid>
- Window>
效果:

这里是添加一行 下面的 Grid.Row="0" 则表示第一行的布局,以及内部添加什么组件等
在第二行的里面又添加了两列 ColumnDefinition,写法同添加行的一样
WPF入门-2 选项卡
1.主页面
- <Window x:Class="WpfApp1.MainWindow"
- xmlns="http://schemas.microsoft.com/winfx/2006/xaml/presentation"
- xmlns:x="http://schemas.microsoft.com/winfx/2006/xaml"
- xmlns:d="http://schemas.microsoft.com/expression/blend/2008"
- xmlns:mc="http://schemas.openxmlformats.org/markup-compatibility/2006"
- xmlns:local="clr-namespace:WpfApp1"
- mc:Ignorable="d"
- Title="MainWindow" Height="450" Width="800">
- <Grid>
- <TabControl>
- <TabItem Header="Page1">
- <Frame Source="/WpfApp1;component/Pages/Page1.xaml"/>
- TabItem>
- <TabItem Header="Page2">
- <Frame Source="/WpfApp1;component/Pages/Page2.xaml"/>
- TabItem>
- <TabItem Header="Page3">
- <Frame Source="/WpfApp1;component/Pages/Page3.xaml"/>
- TabItem>
- <TabItem Header="Page4">
- <Frame Source="/WpfApp1;component/Test/Page4.xaml"/>
- TabItem>
- TabControl>
- Grid>
- Window>
指的是当前选项所指向的页面
2.添加页
在文件夹上点击鼠标右键

添加完成后,如下

在本次学习中,可以在页面中添加一些按钮,lable之类的,用来区分。
其实这里用普通的界面也是可以的,只是要将窗体的最小化,最大化和关闭按钮 去掉,如下

3.运行

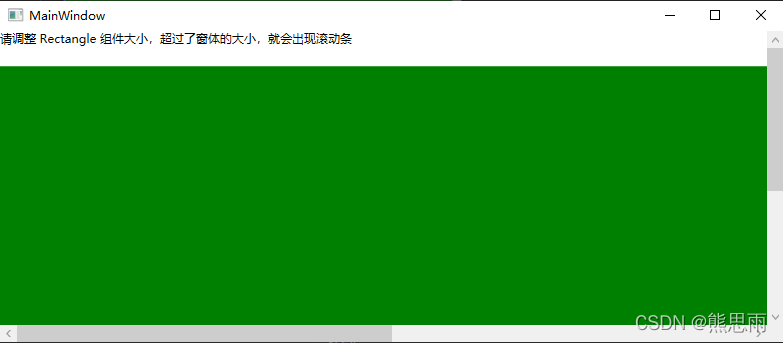
WPF入门-3 滚动条
主界面
用微软官方的案例,不写任何代码
- <Window x:Class="WpfApplication1.MainWindow"
- xmlns="http://schemas.microsoft.com/winfx/2006/xaml/presentation"
- xmlns:x="http://schemas.microsoft.com/winfx/2006/xaml"
- Title="MainWindow" Height="350" Width="800" Loaded="Window_Loaded">
- <Grid>
- <ScrollViewer HorizontalScrollBarVisibility="Auto">
- <StackPanel VerticalAlignment="Top" HorizontalAlignment="Left">
- <TextBlock TextWrapping="Wrap" Margin="0,0,0,20">请调整 Rectangle 组件大小,超过了窗体的大小,就会出现滚动条TextBlock>
- <Rectangle Fill="Green" Width="1500" Height="500">Rectangle>
- StackPanel>
- ScrollViewer>
- Grid>
- Window>
ScrollViewer:滚动条组件
StackPanel:栈面板,子元素超出部分,被隐藏,可以嵌套
Rectangle:绘制矩形
运行
WPF LiveCharts 绘制图表
一、新建项目
新建一个项目 LiveChartBindingDemo,用这个名字,下面的代码你就可以完整的直接复制粘贴就好了,不必再修改。
引入 LiveCharts 插件,在 NuGet 平台自己装就好了,我的版本是0.9.7,图片使用的编辑器是 Visual Studio 2013

二、代码
1.MainWindowViewModel
- using LiveCharts;
- using LiveCharts.Wpf;
- using System;
- using System.Collections.Generic;
- namespace LiveChartBindingDemo
- {
- public class MainWindowViewModel
- {
- SeriesCollection lineSeriesCollection = new SeriesCollection();
- SeriesCollection colunmSeriesCollection = new SeriesCollection();
- SeriesCollection pieSeriesCollection = new SeriesCollection();
- List<string> _lineXLabels = new List<string>();
- List<string> _columnXLabels = new List<string>();
- public MainWindowViewModel()
- {
- GetLineSeriesData();
- GetColunmSeriesData();
- GetPieSeriesData();
- }
- #region 属性
- ///
- /// 折线图集合
- ///
- public SeriesCollection LineSeriesCollection
- {
- get
- {
- return lineSeriesCollection;
- }
- set
- {
- lineSeriesCollection = value;
- }
- }
- ///
- /// 柱状图集合
- ///
- public SeriesCollection ColunmSeriesCollection
- {
- get
- {
- return colunmSeriesCollection;
- }
- set
- {
- colunmSeriesCollection = value;
- }
- }
- ///
- /// 饼图图集合
- ///
- public SeriesCollection PieSeriesCollection
- {
- get
- {
- return pieSeriesCollection;
- }
- set
- {
- pieSeriesCollection = value;
- }
- }
- ///
- /// 折线图X坐标
- ///
- public List<string> LineXLabels
- {
- get
- {
- return _lineXLabels;
- }
- set
- {
- _lineXLabels = value;
- }
- }
- ///
- /// 柱状图X坐标
- ///
- public List<string> ColumnXLabels
- {
- get
- {
- return _columnXLabels;
- }
- set
- {
- _columnXLabels = value;
- }
- }
- #endregion
- #region 方法
- void GetLineSeriesData()
- {
- List<string> titles = new List<string> { "苹果", "香蕉", "梨" };
- List
- {
- new List<double> { 30, 40, 60 },
- new List<double> { 20, 10, 50 },
- new List<double> { 10, 50, 30 }
- };
- List<string> _dates = new List<string>();
- _dates = GetCurrentMonthDates();
- for (int i = 0; i < titles.Count; i++)
- {
- LineSeries lineseries = new LineSeries();
- lineseries.DataLabels = true;
- lineseries.Title = titles[i];
- lineseries.Values = new ChartValues<double>(values[i]);
- LineXLabels.Add(_dates[i]);
- LineSeriesCollection.Add(lineseries);
- }
- }
- void GetColunmSeriesData()
- {
- List<string> titles = new List<string> { "Edge", "Chrome", "Firefox", "Other" };
- List<double> columnValues = new List<double> { 10, 70, 15, 5 };
- for (int i = 0; i < titles.Count; i++)
- {
- ColumnXLabels.Add(titles[i]);
- }
- ColumnSeries colunmseries = new ColumnSeries();
- colunmseries.DataLabels = true;
- colunmseries.Title = "占额";
- colunmseries.Values = new ChartValues<double>(columnValues);
- ColunmSeriesCollection.Add(colunmseries);
- }
- void GetPieSeriesData()
- {
- List<string> titles = new List<string> { "C#", "Java", "Python" };
- List<double> pieValues = new List<double> { 60, 30, 10 };
- ChartValues<double> chartvalue = new ChartValues<double>();
- for (int i = 0; i < titles.Count; i++)
- {
- chartvalue = new ChartValues<double>();
- chartvalue.Add(pieValues[i]);
- PieSeries series = new PieSeries();
- series.DataLabels = true;
- series.Title = titles[i];
- series.Values = chartvalue;
- PieSeriesCollection.Add(series);
- }
- }
- void ThreeColumnData()
- {
- List<string> titles = new List<string> { "苹果", "香蕉", "梨" };
- //三列示例数据
- List
- {
- new List<double> { 30, 40, 60 },
- new List<double> { 20, 10, 50 },
- new List<double> { 10, 50, 30 }
- };
- for (int i = 0; i < titles.Count; i++)
- {
- ColumnSeries colunmseries = new ColumnSeries();
- colunmseries.DataLabels = true;
- colunmseries.Title = titles[i];
- colunmseries.Values = new ChartValues<double>(threeColunmValues[i]);
- ColunmSeriesCollection.Add(colunmseries);
- }
- }
- ///
- /// 获取当前月的每天的日期
- ///
- ///
日期集合 - List<string> GetCurrentMonthDates()
- {
- List<string> dates = new List<string>();
- DateTime dt = DateTime.Now;
- int year = dt.Year;
- int mouth = dt.Month;
- int days = DateTime.DaysInMonth(year, mouth);
- //本月第一天时间
- DateTime dt_First = dt.AddDays(1 - (dt.Day));
- dates.Add(String.Format("{0:d}", dt_First.Date));
- for (int i = 1; i < days; i++)
- {
- DateTime temp = dt_First.AddDays(i);
- dates.Add(String.Format("{0:d}", temp.Date));
- }
- return dates;
- }
- #endregion
- }
- }
2.前端代码 MainWindow.xaml
- <Window x:Class="LiveChartBindingDemo.MainWindow"
- xmlns="http://schemas.microsoft.com/winfx/2006/xaml/presentation"
- xmlns:x="http://schemas.microsoft.com/winfx/2006/xaml"
- xmlns:d="http://schemas.microsoft.com/expression/blend/2008"
- xmlns:lvc="clr-namespace:LiveCharts.Wpf;assembly=LiveCharts.Wpf"
- xmlns:mc="http://schemas.openxmlformats.org/markup-compatibility/2006"
- xmlns:local="clr-namespace:LiveChartBindingDemo"
- mc:Ignorable="d"
- Title="MainWindow"
- Height="720"
- Width="1280">
- <UniformGrid>
- <lvc:CartesianChart Series="{Binding LineSeriesCollection}"
- LegendLocation="Right">
- <lvc:CartesianChart.AxisY>
- <lvc:Axis>lvc:Axis>
- lvc:CartesianChart.AxisY>
- <lvc:CartesianChart.AxisX>
- <lvc:Axis Labels="{Binding LineXLabels}">lvc:Axis>
- lvc:CartesianChart.AxisX>
- lvc:CartesianChart>
- <lvc:CartesianChart Series="{Binding ColunmSeriesCollection}" LegendLocation="Right">
- <lvc:CartesianChart.AxisX>
- <lvc:Axis Labels="{Binding ColumnXLabels}">lvc:Axis>
- lvc:CartesianChart.AxisX>
- <lvc:CartesianChart.AxisY>
- <lvc:Axis>lvc:Axis>
- lvc:CartesianChart.AxisY>
- lvc:CartesianChart>
- <lvc:PieChart LegendLocation="Bottom" Series="{Binding PieSeriesCollection}" DataClick="Chart_OnDataClick" Hoverable="False">
- <lvc:PieChart.DataTooltip>
- <lvc:DefaultTooltip BulletSize="10">lvc:DefaultTooltip>
- lvc:PieChart.DataTooltip>
- lvc:PieChart>
- UniformGrid>
- Window>
3.后端代码 MainWindow.xaml.cs
- using LiveCharts;
- using LiveCharts.Wpf;
- using System.Windows;
- namespace LiveChartBindingDemo
- {
- ///
- /// MainWindow.xaml 的交互逻辑
- ///
- public partial class MainWindow : Window
- {
- MainWindowViewModel mainWindowViewModel = new MainWindowViewModel();
- public MainWindow()
- {
- InitializeComponent();
- this.DataContext = mainWindowViewModel;
- }
- private void Chart_OnDataClick(object sender, ChartPoint chartpoint)
- {
- var chart = (LiveCharts.Wpf.PieChart)chartpoint.ChartView;
- //clear selected slice.
- foreach (PieSeries series in chart.Series)
- series.PushOut = 0;
- var selectedSeries = (PieSeries)chartpoint.SeriesView;
- selectedSeries.PushOut = 8;
- }
- }
- }
以上就是所有的完整代码了,项目结构如下:

三、运行

WPF 百分比计算器
设计了一个小工具,界面如下:

xaml
- <Window x:Class="WpfApplication1.MainWindow"
- xmlns="http://schemas.microsoft.com/winfx/2006/xaml/presentation"
- xmlns:x="http://schemas.microsoft.com/winfx/2006/xaml"
- ResizeMode ="CanMinimize" WindowStartupLocation="CenterScreen"
- Title="百分比计算器" Height="200" Width="300" Loaded="Window_Loaded">
- <Grid>
- <Label Content="总数量:" HorizontalAlignment="Left" VerticalAlignment="Top" Margin="36,21,0,0" />
- <Label Content="你的数量:" HorizontalAlignment="Left" VerticalAlignment="Top" Margin="36,51,0,0"/>
- <Label Content="结果:" HorizontalAlignment="Left" VerticalAlignment="Top" Margin="36,76,0,0"/>
- <Label Name="Label_Result" Content="" HorizontalAlignment="Left" VerticalAlignment="Top" Margin="110,76,0,0"/>
- <TextBox Name="TextBox_AllNum" Width="120" Height="23" Margin="110,25,0,0" TextWrapping="Wrap" Text="" HorizontalAlignment="Left" VerticalAlignment="Top" />
- <TextBox Name="TextBox_YourNum" Width="120" Height="23" Margin="110,53,0,0" TextWrapping="Wrap" Text="" HorizontalAlignment="Left" VerticalAlignment="Top" />
- <Button Content="计算" HorizontalAlignment="Left" Margin="110,127,0,0" VerticalAlignment="Top" Width="75" Click="Button_Click"/>
- Grid>
- Window>
后台代码:
- using System;
- using System.Windows;
- namespace WpfApplication1
- {
- public partial class MainWindow : Window
- {
- public MainWindow()
- {
- InitializeComponent();
- }
- private void Window_Loaded(object sender, RoutedEventArgs e)
- {
- }
- private void Button_Click(object sender, RoutedEventArgs e)
- {
- //总数量
- string s_allNum = this.TextBox_AllNum.Text;
- //你的数量
- string s_yourNum = this.TextBox_YourNum.Text;
- if (string.IsNullOrEmpty(s_allNum) || string.IsNullOrEmpty(s_yourNum))
- {
- MessageBox.Show("输入框不能为空");
- return;
- }
- double allNum = 0;
- double yourNum = 0;
- if (!double.TryParse(s_allNum, out allNum))
- {
- MessageBox.Show("总数量 输入框 输入的不是一个数字");
- return;
- }
- if (!double.TryParse(s_yourNum, out yourNum))
- {
- MessageBox.Show("你的数量 输入框 输入的不是一个数字");
- return;
- }
- if (yourNum > allNum)
- {
- MessageBox.Show("你的数量 不能大于 总数");
- return;
- }
- double result = (yourNum / allNum) * 100;
- this.Label_Result.Content = string.Format("{0}%", Math.Round(result, 4));
- }
- }
- }
效果:


WPF 获取 DataGrid 控件选中当前行某个列的值
先新建一个工程,界面如下:

这个项目按我之前写的例子上加的,链接:点击跳转
其实原来的项目也可以不用管,怎么获取DataGrid中的值才是本章的重点,
在DataGrid 下面添加一个按钮,按钮的点击事件如下:
- private void Button_Click(object sender, RoutedEventArgs e)
- {
- string value = GetSelectedRow(MyDataGrid, "Name");
- Console.WriteLine(value);
- }
封装获取点击行,某个列的值的方法
- ///
- /// 获取DataGrid控件选中当前行某个列的值
- ///
- /// DataGrid控件
- /// 列的名字
- ///
选中行列的值,参数错误则返回null - public string GetSelectedRow(DataGrid dataGrid, string readName)
- {
- if (dataGrid == null)
- {
- Console.WriteLine("dataGrid 不能为空");
- return null;
- }
- if (string.IsNullOrEmpty(readName))
- {
- Console.WriteLine("readName不能为空");
- return null;
- }
- if (dataGrid.SelectedItems.Count == 0)
- {
- Console.WriteLine("dataGrid未选中任何数据");
- return null;
- }
- if (dataGrid.SelectedItems.Count > 1)
- {
- Console.WriteLine("不支持选中多行,读取某一个数据");
- return null;
- }
- DataRowView dataRowView = dataGrid.SelectedCells[0].Item as DataRowView;
- if (dataRowView.Row.Table.Columns.Contains(readName))
- return dataRowView[readName].ToString();
- return null;
- }
运行:
先选中一行,然后点击测试,成功获取到值


WPF LiveCharts 案例集合
学习资料
LiveCharts官方文档:点击跳转
一、柱状图
案例1
效果:

前端
- <Window x:Class="WpfApplication1.MainWindow"
- xmlns="http://schemas.microsoft.com/winfx/2006/xaml/presentation"
- xmlns:x="http://schemas.microsoft.com/winfx/2006/xaml"
- xmlns:d="http://schemas.microsoft.com/expression/blend/2008"
- xmlns:mc="http://schemas.openxmlformats.org/markup-compatibility/2006"
- xmlns:lvc="clr-namespace:LiveCharts.Wpf;assembly=LiveCharts.Wpf"
- Title="MainWindow" Width="700" Height="400" >
- <Grid>
- <lvc:CartesianChart Margin="20,75,20,15">
- <lvc:CartesianChart.AxisX>
- <lvc:Axis FontSize="12" Labels="{Binding Path=StorageLabels}" Title="库位" LabelsRotation="20">
- <lvc:Axis.Separator>
- <lvc:Separator Step="1" IsEnabled="False"/>
- lvc:Axis.Separator>
- lvc:Axis>
- lvc:CartesianChart.AxisX>
- <lvc:CartesianChart.AxisY>
- <lvc:Axis FontSize="12" Title="百分比" ShowLabels="True" LabelFormatter="{Binding Path=AxisPercentage}">
- <lvc:Axis.Separator>
- <lvc:Separator Stroke="#33ffffff" StrokeDashArray="10"/>
- lvc:Axis.Separator>
- lvc:Axis>
- lvc:CartesianChart.AxisY>
- <lvc:CartesianChart.Series>
- <lvc:ColumnSeries Values="{Binding Path=StoragePercentages}" DataLabels="True" LabelsPosition="Top"/>
- lvc:CartesianChart.Series>
- <lvc:CartesianChart.ChartLegend>
- <lvc:DefaultLegend BulletSize="12"/>
- lvc:CartesianChart.ChartLegend>
- lvc:CartesianChart>
- Grid>
- Window>
后端
- using LiveCharts;
- using LiveCharts.Wpf;
- using System;
- using System.Windows;
- namespace WpfApplication1
- {
- ///
- /// Interaction logic for MainWindow.xaml
- ///
- public partial class MainWindow : Window
- {
- private Func<double, string> _axisPercentage;
- private string[] _storageLabels;
- private IChartValues _storagePercentages;
- public Func<double, string> AxisPercentage
- {
- get { return _axisPercentage; }
- set { _axisPercentage = value; }
- }
- public string[] StorageLabels
- {
- get { return _storageLabels; }
- set { _storageLabels = value; }
- }
- public IChartValues StoragePercentages
- {
- get { return _storagePercentages; }
- set { _storagePercentages = value; }
- }
- private void ShowStoragePercentageColumnChart()
- {
- StorageLabels = new[]
- {
- "单元一原料","单元一成品","单元二原料","单元二半成品","单元三原料","单元三半成品","单元四原料","单元四半成品"
- };
- AxisPercentage = val => val.ToString("P");
- StoragePercentages = new ChartValues<double> { 0.2, 0.5, 0.44, 0.88, 0.22, 0.6, 0.14, 0.09 };
- this.DataContext = this;
- }
- public MainWindow()
- {
- InitializeComponent();
- ShowStoragePercentageColumnChart();
- }
- }
- }
案例2
效果

前端
"Test1.MainWindow" - xmlns="http://schemas.microsoft.com/winfx/2006/xaml/presentation"
- xmlns:x="http://schemas.microsoft.com/winfx/2006/xaml"
- xmlns:d="http://schemas.microsoft.com/expression/blend/2008"
- xmlns:lvc="clr-namespace:LiveCharts.Wpf;assembly=LiveCharts.Wpf"
- xmlns:mc="http://schemas.openxmlformats.org/markup-compatibility/2006"
- Title="MainWindow" Width="1280" Height="720" Loaded="Window_Loaded">
后端
- using System.Windows;
- using LiveCharts;
- namespace Test1
- {
- ///
- /// MainWindow.xaml 的交互逻辑
- ///
- public partial class MainWindow : Window
- {
- public MainWindow()
- {
- InitializeComponent();
- }
- public ChartValues<double> Values1 { get; set; }
- public ChartValues<double> Values2 { get; set; }
- private void Window_Loaded(object sender, RoutedEventArgs e)
- {
- Values1 = new ChartValues<double> {3, 5, 2, 6, 2, 7, 1};
- Values2 = new ChartValues<double> {6, 2, 6, 3, 2, 7, 2};
- DataContext = this;
- }
- }
- }
二、饼状图
案例1
效果

前端
- <Window x:Class="LiveChartBindingDemo.MainWindow"
- xmlns="http://schemas.microsoft.com/winfx/2006/xaml/presentation"
- xmlns:x="http://schemas.microsoft.com/winfx/2006/xaml"
- xmlns:d="http://schemas.microsoft.com/expression/blend/2008"
- xmlns:lvc="clr-namespace:LiveCharts.Wpf;assembly=LiveCharts.Wpf"
- xmlns:mc="http://schemas.openxmlformats.org/markup-compatibility/2006"
- Title="MainWindow" Width="400" Height="300">
- <UniformGrid>
- <lvc:PieChart LegendLocation="Bottom" Series="{Binding PieSeriesCollection}" DataClick="Chart_OnDataClick" Hoverable="False">
- <lvc:PieChart.DataTooltip>
- <lvc:DefaultTooltip BulletSize="10">lvc:DefaultTooltip>
- lvc:PieChart.DataTooltip>
- lvc:PieChart>
- UniformGrid>
- Window>
后端
- using LiveCharts;
- using LiveCharts.Wpf;
- using System;
- using System.Windows;
- namespace LiveChartBindingDemo
- {
- ///
- /// MainWindow.xaml 的交互逻辑
- ///
- public partial class MainWindow : Window
- {
- MainWindowViewModel mainWindowViewModel = new MainWindowViewModel();
- public MainWindow()
- {
- InitializeComponent();
- this.DataContext = mainWindowViewModel;
- }
- private void Chart_OnDataClick(object sender, ChartPoint chartpoint)
- {
- var chart = (LiveCharts.Wpf.PieChart)chartpoint.ChartView;
- foreach (PieSeries series in chart.Series)
- series.PushOut = 0;
- var selectedSeries = (PieSeries)chartpoint.SeriesView;
- selectedSeries.PushOut = 8;
- }
- }
- }
绑定数据
- using LiveCharts;
- using LiveCharts.Wpf;
- using System;
- using System.Collections.Generic;
- using System.Windows;
- namespace LiveChartBindingDemo
- {
- public class MainWindowViewModel
- {
- SeriesCollection pieSeriesCollection = new SeriesCollection();
- public MainWindowViewModel()
- {
- GetPieSeriesData();
- }
- #region 属性
- ///
- /// 饼图图集合
- ///
- public SeriesCollection PieSeriesCollection
- {
- get { return pieSeriesCollection; }
- set { pieSeriesCollection = value; }
- }
- #endregion
- #region 方法
- void GetPieSeriesData()
- {
- List<string> titles = new List<string> { "C#", "Java", "Python" };
- List<double> pieValues = new List<double> { 60, 30, 10 };
- ChartValues<double> chartvalue = new ChartValues<double>();
- for (int i = 0; i < titles.Count; i++)
- {
- chartvalue = new ChartValues<double>();
- chartvalue.Add(pieValues[i]);
- PieSeries series = new PieSeries();
- series.DataLabels = true;
- series.Title = titles[i];
- series.Values = chartvalue;
- PieSeriesCollection.Add(series);
- }
- }
- #endregion
- }
- }
三、折线图
案例1
效果

前端
- <Window x:Class="LiveChartBindingDemo.MainWindow"
- xmlns="http://schemas.microsoft.com/winfx/2006/xaml/presentation"
- xmlns:x="http://schemas.microsoft.com/winfx/2006/xaml"
- xmlns:d="http://schemas.microsoft.com/expression/blend/2008"
- xmlns:lvc="clr-namespace:LiveCharts.Wpf;assembly=LiveCharts.Wpf"
- xmlns:mc="http://schemas.openxmlformats.org/markup-compatibility/2006"
- Title="MainWindow" Width="400" Height="300">
- <UniformGrid>
- <lvc:CartesianChart Series="{Binding LineSeriesCollection}" LegendLocation="Right">
- <lvc:CartesianChart.AxisY>
- <lvc:Axis>lvc:Axis>
- lvc:CartesianChart.AxisY>
- <lvc:CartesianChart.AxisX>
- <lvc:Axis Labels="{Binding LineXLabels}">lvc:Axis>
- lvc:CartesianChart.AxisX>
- lvc:CartesianChart>
- UniformGrid>
- Window>
后端
- using LiveCharts;
- using LiveCharts.Wpf;
- using System;
- using System.Windows;
- namespace LiveChartBindingDemo
- {
- ///
- /// MainWindow.xaml 的交互逻辑
- ///
- public partial class MainWindow : Window
- {
- MainWindowViewModel mainWindowViewModel = new MainWindowViewModel();
- public MainWindow()
- {
- InitializeComponent();
- this.DataContext = mainWindowViewModel;
- }
- }
- }
MainWindowViewModel
- using LiveCharts;
- using LiveCharts.Wpf;
- using System;
- using System.Collections.Generic;
- using System.Windows;
- namespace LiveChartBindingDemo
- {
- public class MainWindowViewModel
- {
- private SeriesCollection lineSeriesCollection = new SeriesCollection();
- private List<string> _lineXLabels = new List<string>();
- public MainWindowViewModel()
- {
- GetLineSeriesData();
- }
- #region 属性
- ///
- /// 折线图集合
- ///
- public SeriesCollection LineSeriesCollection
- {
- get { return lineSeriesCollection; }
- set { lineSeriesCollection = value; }
- }
- ///
- /// 折线图X坐标
- ///
- public List<string> LineXLabels
- {
- get { return _lineXLabels; }
- set { _lineXLabels = value; }
- }
- #endregion
- #region 方法
- private void GetLineSeriesData()
- {
- List<string> titles = new List<string> { "苹果", "香蕉", "梨" };
- List
- {
- new List<double> { 30, 40, 60 },
- new List<double> { 20, 10, 50 },
- new List<double> { 10, 50, 30 }
- };
- List<string> _dates = new List<string>();
- _dates = GetCurrentMonthDates();
- for (int i = 0; i < titles.Count; i++)
- {
- LineSeries lineseries = new LineSeries();
- lineseries.DataLabels = true;
- lineseries.Title = titles[i];
- lineseries.Values = new ChartValues<double>(values[i]);
- LineXLabels.Add(_dates[i]);
- LineSeriesCollection.Add(lineseries);
- }
- }
- ///
- /// 获取当前月的每天的日期
- ///
- ///
日期集合 - private List<string> GetCurrentMonthDates()
- {
- List<string> dates = new List<string>();
- DateTime dt = DateTime.Now;
- int year = dt.Year;
- int mouth = dt.Month;
- int days = DateTime.DaysInMonth(year, mouth);
- //本月第一天时间
- DateTime dt_First = dt.AddDays(1 - (dt.Day));
- dates.Add(String.Format("{0:d}", dt_First.Date));
- for (int i = 1; i < days; i++)
- {
- DateTime temp = dt_First.AddDays(i);
- dates.Add(String.Format("{0:d}", temp.Date));
- }
- return dates;
- }
- #endregion
- }
- }
WPF 绑定数据和数据刷新
1.ViewModelBase
主要用做前端界面更新数据的通知
- using System;
- using System.Collections.Generic;
- using System.Linq;
- using System.Text;
- using System.Threading.Tasks;
- namespace WpfApplication2
- {
- ///
- /// 实现了属性更改通知的基类
- ///
- public class ViewModelBase : System.ComponentModel.INotifyPropertyChanged
- {
- public virtual event System.ComponentModel.PropertyChangedEventHandler PropertyChanged;
- ///
- /// 属性值变化时发生
- ///
- ///
- protected virtual void OnPropertyChanged(string propertyName)
- {
- if (this.PropertyChanged != null)
- this.PropertyChanged(this, new System.ComponentModel.PropertyChangedEventArgs(propertyName));
- }
- ///
- /// 属性值变化时发生
- ///
- ///
- protected virtual void OnPropertyChanged<T>(System.Linq.Expressions.Expression
- {
- var propertyName = (propertyExpression.Body as System.Linq.Expressions.MemberExpression).Member.Name;
- this.OnPropertyChanged(propertyName);
- }
- }
- }
2.前端代码
"WpfApplication2.MainWindow" - xmlns="http://schemas.microsoft.com/winfx/2006/xaml/presentation"
- xmlns:x="http://schemas.microsoft.com/winfx/2006/xaml"
- Title="MainWindow" Width="300" Height="200" Loaded="Window_Loaded">
3.后端代码
- using System;
- using System.ComponentModel;
- using System.Windows;
- namespace WpfApplication2
- {
- ///
- /// MainWindow.xaml 的交互逻辑
- ///
- public partial class MainWindow : Window
- {
- public MainWindow()
- {
- InitializeComponent();
- }
- private Test Tests = new Test();
- private void Window_Loaded(object sender, RoutedEventArgs e)
- {
- Tests.MyLable = "默认值";
- this.DataContext = Tests;
- }
- private void Button_Click(object sender, RoutedEventArgs e)
- {
- Random r = new Random();
- int randomNum = r.Next(1, 100);
- string content = string.Format("随机数:{0}", randomNum);
- Tests.MyLable = content;
- }
- }
- public class Test : ViewModelBase
- {
- private string myLable;
- public string MyLable
- {
- get { return myLable; }
- set { myLable = value; this.OnPropertyChanged("MyLable"); }
- }
- }
- }
在这里新建了一个类,并继承了 ViewModeBase,在 MyLable Set 访问器中,加入了 数据更新通知,另外 this.DataContext = Tests; 这句是给前端数据绑定的类
测试
运行后,界面如下:

点击 Test 按钮,可以看到,数据成功在后台更新了

WPF 解决 LiveCharts 中 Labels 显示不全的问题
在显示柱状图时,绑定的 Labels 数组明明是完整的,但是在图表中就是只显示不完整,如下图:

底下的列名,有的显示,有的不显示。
网上查了一圈,也没看到什么有用的例子,后面终于在github 上看到了答案
有兴趣的可以去看看:点击跳转
当然,下面也会介绍解决的方法。
二、源代码
这里是上面的图片原代码
前端:
- <Window x:Class="WpfApplication1.MainWindow"
- xmlns="http://schemas.microsoft.com/winfx/2006/xaml/presentation"
- xmlns:x="http://schemas.microsoft.com/winfx/2006/xaml"
- xmlns:lvc="clr-namespace:LiveCharts.Wpf;assembly=LiveCharts.Wpf"
- Title="MainWindow" Height="350" Width="525">
- <Grid>
- <lvc:CartesianChart Name="LineChart" LegendLocation="top" >
- <lvc:CartesianChart.AxisY>
- <lvc:Axis Title="Sales" >lvc:Axis>
- lvc:CartesianChart.AxisY>
- <lvc:CartesianChart.AxisX>
- <lvc:AxesCollection>
- <lvc:Axis Labels="{Binding Labels}"/>
- lvc:AxesCollection>
- lvc:CartesianChart.AxisX>
- lvc:CartesianChart>
- Grid>
- Window>
后端代码:
- using LiveCharts;
- using LiveCharts.Wpf;
- using System.Windows;
- namespace WpfApplication1
- {
- ///
- /// MainWindow.xaml 的交互逻辑
- ///
- public partial class MainWindow : Window
- {
- private SeriesCollection seriesCollection = new SeriesCollection();
- public string[] Labels { get; set; }
- public MainWindow()
- {
- InitializeComponent();
- Labels = new string[] { "第一列", "第二列", "第三列", "第四列", "第五列", "第六列", "第七列", "第八列", "第九列", "第十列" };
- DataContext = this;
- LoadLineChart();
- }
- private void LoadLineChart()
- {
- seriesCollection = new SeriesCollection
- {
- new ColumnSeries
- {
- Title = "1988",
- Values = new ChartValues<double> { 10, 50, 39, 50, 5, 10, 15, 20, 25, 30 }
- }
- };
- LineChart.Series = seriesCollection;
- }
- }
- }
三、解决问题
只需要改前端就行了,如下,重点是加入 Separator标签,和 Step=“1” 这句。
- <Window x:Class="WpfApplication1.MainWindow"
- xmlns="http://schemas.microsoft.com/winfx/2006/xaml/presentation"
- xmlns:x="http://schemas.microsoft.com/winfx/2006/xaml"
- xmlns:lvc="clr-namespace:LiveCharts.Wpf;assembly=LiveCharts.Wpf"
- Title="MainWindow" Height="350" Width="525">
- <Grid>
- <lvc:CartesianChart Name="LineChart" LegendLocation="top" >
- <lvc:CartesianChart.AxisY>
- <lvc:Axis Title="Sales" >lvc:Axis>
- lvc:CartesianChart.AxisY>
- <lvc:CartesianChart.AxisX>
- <lvc:AxesCollection>
- <lvc:Axis Labels="{Binding Labels}">
- <lvc:Axis.Separator>
- <lvc:Separator Step="1" />
- lvc:Axis.Separator>
- lvc:Axis>
- lvc:AxesCollection>
- lvc:CartesianChart.AxisX>
- lvc:CartesianChart>
- Grid>
- Window>
运行测试:

可以看到,完美的解决了问题
end
-
相关阅读:
冰冰学习笔记:反向迭代器的模拟
二、安全与风险管理—安全与风险管理基础
数字图像处理大作业
LeetCode 面试经典150题 80.删除有序数组中的重复项II
C++ Primer Plus 第六章笔记
黑盒测试用例设计 - 等价类划分法
云安全之等级保护详解
【无标题】
docker中使用docker-compose搭建Elasticsearch 7.8.0集群及安装IK分词器
初级篇—第七章数据处理增删改
- 原文地址:https://blog.csdn.net/qq_38693757/article/details/125993367
