-
matlab习题 —— 图像绘制练习
matlab系列文章:👉 目录 👈

一、题目
- (1) 读取附件1
sd.xlsx,以相邻两列数据绘制散点图并标注;以第 1,2,4 列数据绘制空间散点图 - (2) 根据下面图形写出作图语句
- ① y = s i n x y=sinx y=sinx, y = c o s x y=cosx y=cosx 在同一幅图;
- ② y = s i n x y=sinx y=sinx, y = c o s x y=cosx y=cosx 在同一幅图不同窗口
- (3) 数组 [ 2 , 5 , 10 , 12 , 13 , 7 , 2 , 10 , 4 , 6 , 8 , 8 , 4 , 7 , 8 ] [2,5,10,12,13,7,2,10,4,6,8,8,4,7,8] [2,5,10,12,13,7,2,10,4,6,8,8,4,7,8] 作竖直、水平、立体柱状图、饼状图
- (4) 绘制空间曲线 x = e 0.3 t s i n t x=e^{0.3t}sint x=e0.3tsint, y = e 0.3 t c o s t y=e^{0.3t}cost y=e0.3tcost, z = e 0.3 t z=e^{0.3t} z=e0.3t, t ∈ [ 0 , 6 π ] t∈[0,6 \pi] t∈[0,6π]
- (5) 使用
mesh、surf绘制曲面 z = f ( x , y ) = s i n x 2 + y 2 x 2 + y 2 , x . y ∈ [ − 10 , 10 ] z=f(x,y)=\frac{sin{\sqrt{x^2+y^2}}}{\sqrt{x^2+y^2}},x.y\in[-10,10] z=f(x,y)=x2+y2sinx2+y2,x.y∈[−10,10] - (6) 绘制上半球面 z = 4 − x 2 − y 2 z=\sqrt{4-x^2-y^2} z=4−x2−y2 与锥面 z + 2 = x 2 + y 2 z+2=\sqrt{x^2+y^2} z+2=x2+y2 所围成的立体
- (7) 平面 z = 2 x − 3 y z=2x-3y z=2x−3y 截马鞍面 z = x 2 − 2 y 2 z=x^2-2y^2 z=x2−2y2
二、解答
>> [num1]=xlsread('F:\sd.xlsx',1,'A1:B191') >> [num2]=xlsread('F:\sd.xlsx',1,'D1:E191') >> [num3]=xlsread('F:\sd.xlsx',1,'G1:H40')- 1
- 2
- 3
题一
① 读取附件1 sd.xlsx,以相邻两列数据绘制散点图并标注
>> scatter(num1(:,[1]),num1(:,[2]),[],'b','filled') >> hold on >> scatter(num2(:,[1]),num2(:,[2]),[],'r','filled') >> hold on >> scatter(num3(:,[1]),num3(:,[2]),[],'black','filled') >> title('shu ju A B C san dian tu') >> legend('shu ju zu A','shu ju zu B','shu ju zu C')- 1
- 2
- 3
- 4
- 5
- 6
- 7

② 以第 1,2,4 列数据绘制空间散点图
>> scatter3(num1(:,[1]),num1(:,[2]),num2(:,[1]),'filled')- 1

题二
① y = s i n x y=sinx y=sinx, y = c o s x y=cosx y=cosx 在同一幅图
>> x = 0:0.01:2*pi >> y1 = sin(x) >> y2 = cos(x) >> plot(x,y1,x,y2) >> title('The graph of sinx and cosx','color','b') >> legend('y=cosx','y=sinx')- 1
- 2
- 3
- 4
- 5
- 6

② y = s i n x y=sinx y=sinx, y = c o s x y=cosx y=cosx 在同一幅图不同窗口
>> subplot(1,2,1) >> plot(x,y1) >> title('y=sinx') >> box off >> >> subplot(1,2,2) >> plot(x,y2) >> title('y=cosx') >> box off- 1
- 2
- 3
- 4
- 5
- 6
- 7
- 8
- 9

题三
数组 [ 2 , 5 , 10 , 12 , 13 , 7 , 2 , 10 , 4 , 6 , 8 , 8 , 4 , 7 , 8 ] [2,5,10,12,13,7,2,10,4,6,8,8,4,7,8] [2,5,10,12,13,7,2,10,4,6,8,8,4,7,8]
>> % 读数据 >> data = [2,5,10,12,13,7,2,10,4,6,8,8,4,7,8]- 1
- 2
① 竖直柱状图
>> bar(data)- 1

② 水平柱状图
>> barh(data)- 1

③ 立体柱状图
>> bar3(data)- 1

④ 饼状图
>> pie(data)- 1

题四
① 绘制空间曲线 x = e 0.3 t s i n t x=e^{0.3t}sint x=e0.3tsint, y = e 0.3 t c o s t y=e^{0.3t}cost y=e0.3tcost, z = e 0.3 t z=e^{0.3t} z=e0.3t, t ∈ [ 0 , 6 π ] t∈[0,6 \pi] t∈[0,6π]
>> t = 0:0.01:6*pi >> x = exp(0.3*t).*sin(t) >> y = exp(0.3*t).*cos(t) >> z = exp(0.3*t) >> plot3(x,y,z)- 1
- 2
- 3
- 4
- 5

题五
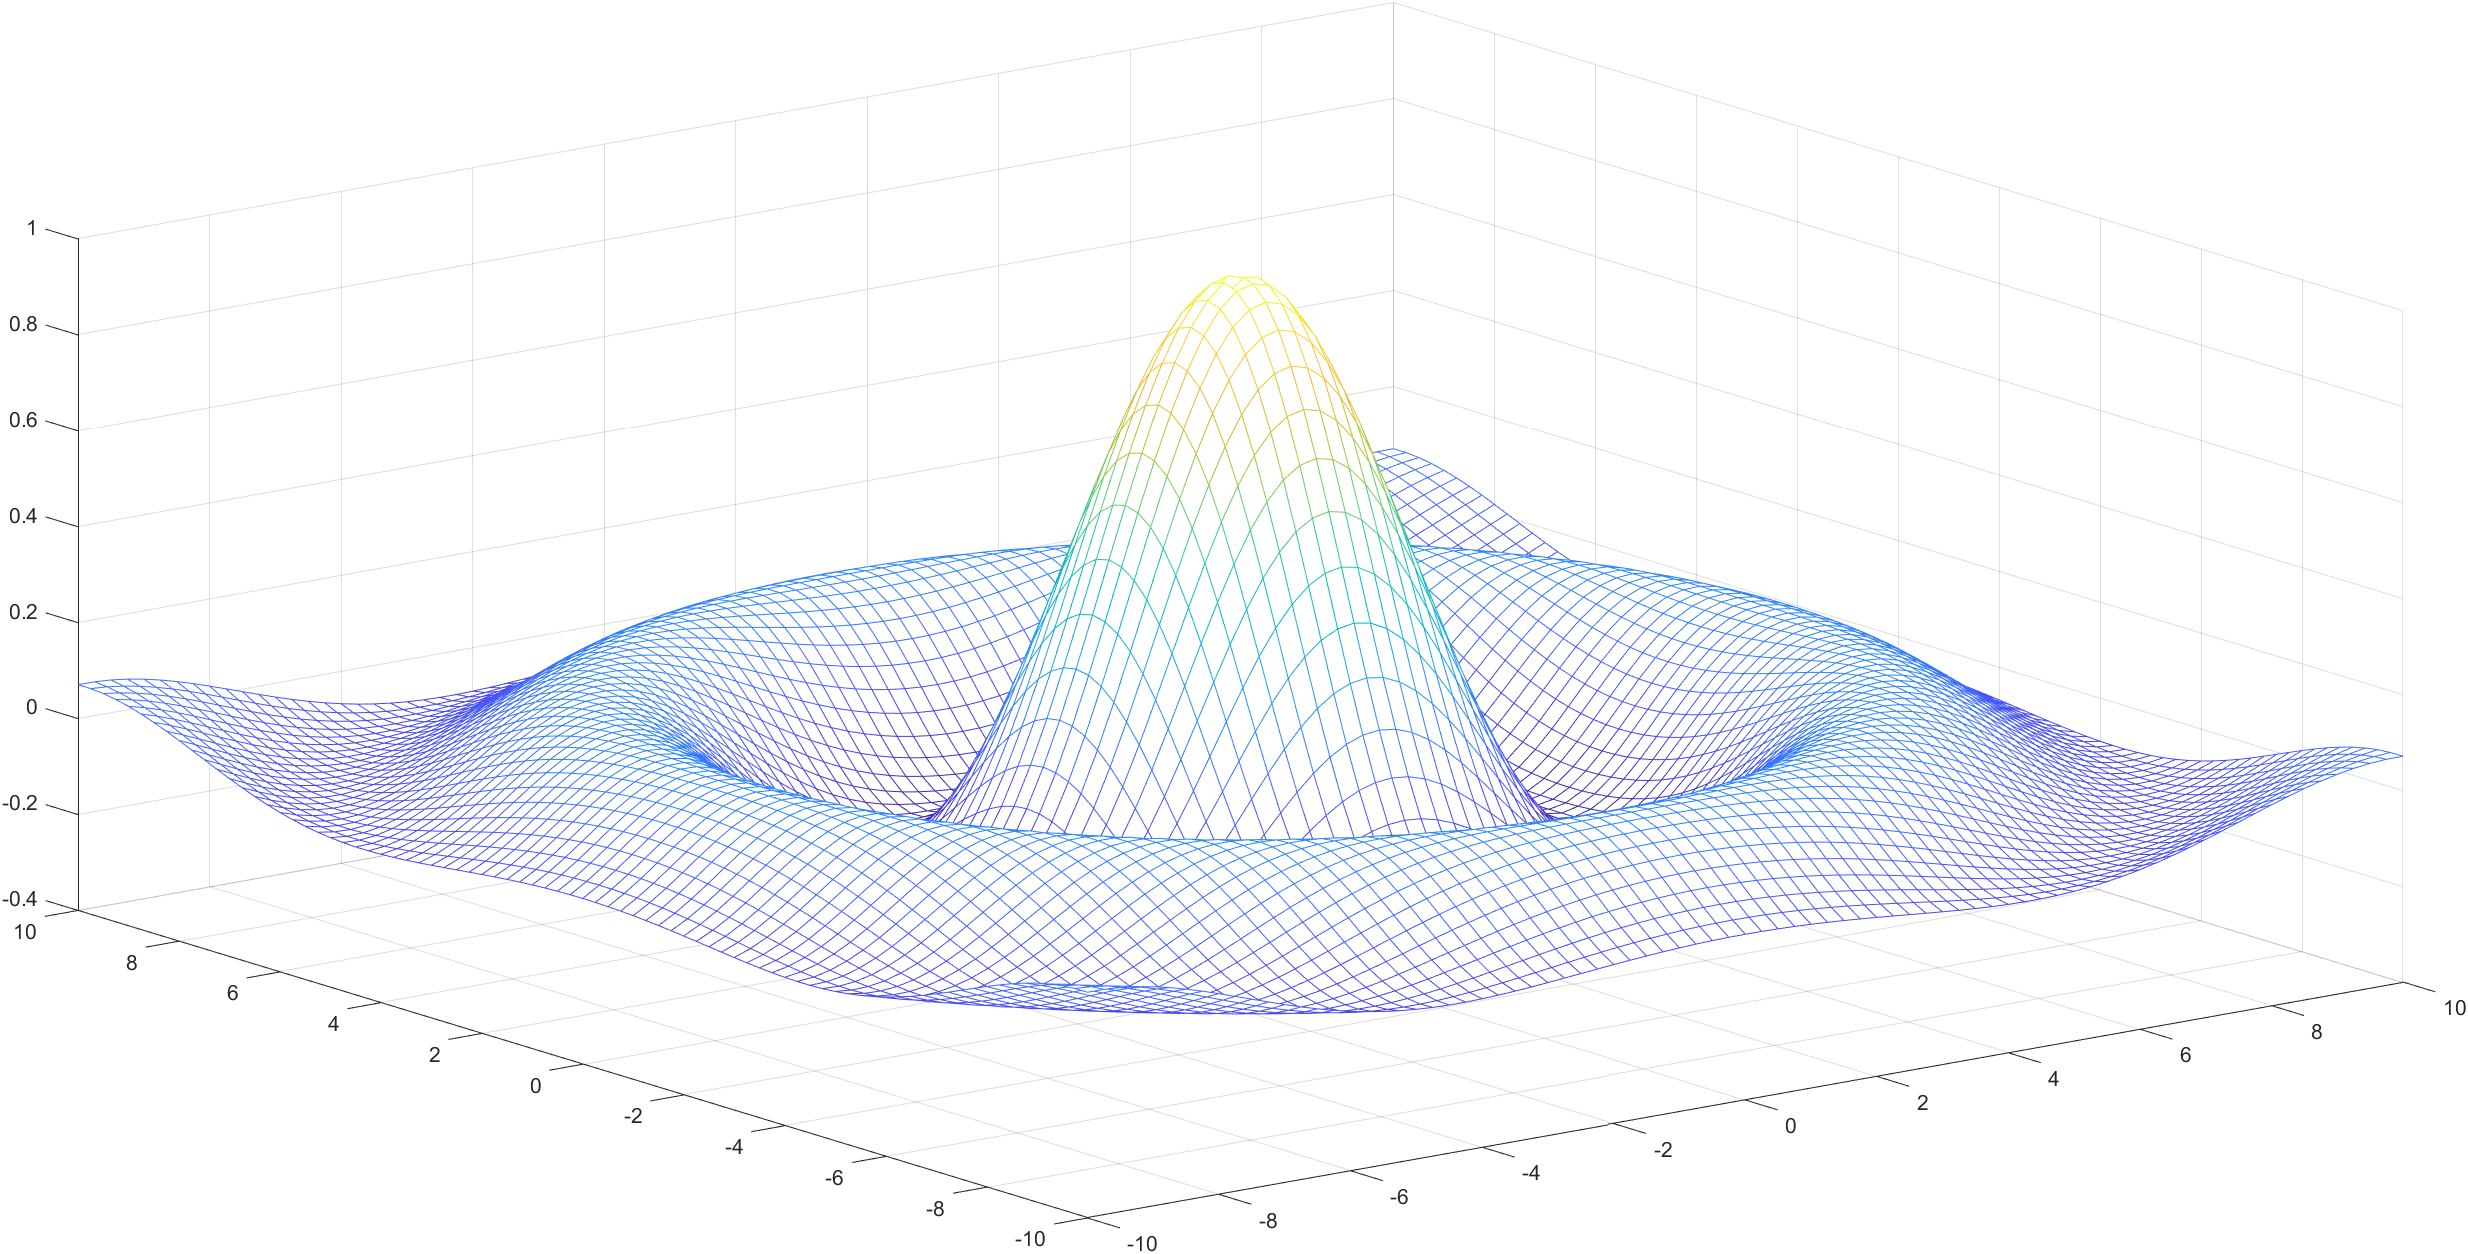
① 使用 mesh、surf 绘制曲面 z = f ( x , y ) = s i n x 2 + y 2 x 2 + y 2 , x . y ∈ [ − 10 , 10 ] z=f(x,y)=\frac{sin{\sqrt{x^2+y^2}}}{\sqrt{x^2+y^2}},x.y\in[-10,10] z=f(x,y)=x2+y2sinx2+y2,x.y∈[−10,10]
>> x = -10:0.25:10 >> y = -10:0.25:10 >> [x,y] = meshgrid(x,y) >> R = (x.^2+y.^2).^(1/2) >> z = sin(R)./R >> >> mesh(x,y,z) >> >>- 1
- 2
- 3
- 4
- 5
- 6
- 7
- 8
- 9
Ⅰ、mesh 图像
Ⅱ、surf 图像

题六
① 绘制上半球面 z = 4 − x 2 − y 2 z=\sqrt{4-x^2-y^2} z=4−x2−y2 与锥面 z + 2 = x 2 + y 2 z+2=\sqrt{x^2+y^2} z+2=x2+y2 所围成的立体
>> x=-2:0.01:2; >> y=-2:0.01:2; >> [x,y]=meshgrid(x,y); >> z1=real(sqrt(4-x.^2-y.^2)); >> z2=sqrt(x.^2+y.^2)-2; >> surf(x,y,z1),shading flat >> hold on >> z2(z2>0)=NaN; >> surf(x,y,z2),shading flat- 1
- 2
- 3
- 4
- 5
- 6
- 7
- 8
- 9

题七
① 平面 z = 2 x − 3 y z=2x-3y z=2x−3y 截马鞍面 z = x 2 − 2 y 2 z=x^2-2y^2 z=x2−2y2
>> x = -20:.1:20 >> y = -20:.1:20 >> [x,y]=meshgrid(x,y) >> z1 = 2*x-3*y >> z2 = x.^2-2*y.^2 >> mesh(x,y,z1) >> hold on >> mesh(x,y,z2)- 1
- 2
- 3
- 4
- 5
- 6
- 7
- 8


- (1) 读取附件1
-
相关阅读:
js手撕代码
信息论与编码——信道编码
MQ进阶面试题
WPF-控件的常用属性-单例-隧道事件
解决git action定时任务执行失败的方法
linux使用scp命令来在两台Linux设备之间传输文件
宏观经济学复习
kohya_ss环境部署及训练
传奇开服很难吗?教你怎么给Hero传奇引擎添加NPC
STL之容器、迭代器、算法、仿函数
- 原文地址:https://blog.csdn.net/qq_21484461/article/details/125496882