-
python给一行数据绘制饼图
参考链接:
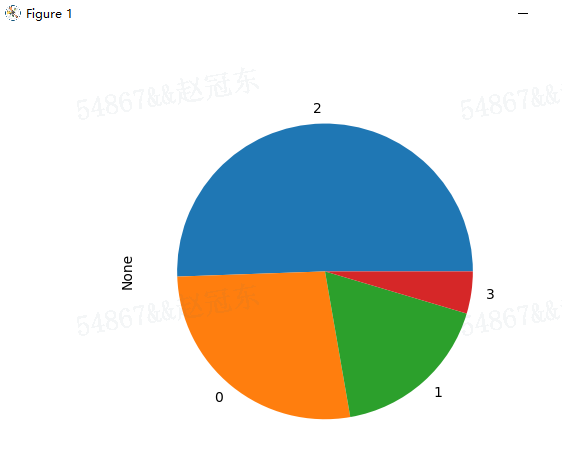
https://www.runoob.com/matplotlib/matplotlib-pie.htmlkm_model.labels_ Out[8]: array([2, 2, 0, ..., 0, 2, 0]) a1 = a.value_counts() a1 Out[11]: 2 813 0 437 1 284 3 74 dtype: int64 a1.plot(kind='pie') Out[14]: <AxesSubplot:ylabel='None'>- 1
- 2
- 3
- 4
- 5
- 6
- 7
- 8
- 9
- 10
- 11
- 12
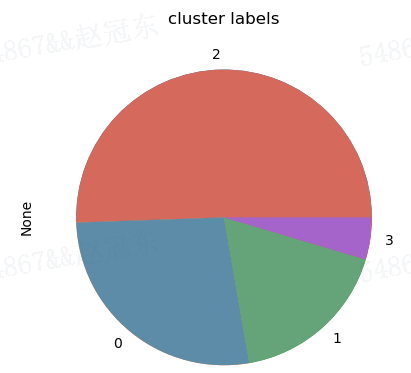
plt.pie(a1, colors=["#d5695d", "#5d8ca8", "#65a479", "#a564c9"], ) plt.title("cluster labels") plt.show()- 1
- 2
- 3
- 4
- 5
plt.pie(a1, colors=["#d5695d", "#5d8ca8", "#65a479", "#a564c9"], autopct='%.2f%%' ) plt.title("cluster labels") plt.show()- 1
- 2
- 3
- 4
- 5
- 6

-
相关阅读:
计算机组成原理笔记(王道考研) 第二章:数据的表示和运算2
python牛客网刷题查漏补缺1
C#反射实现插件式开发
【高级算法设计与分析】实验2:单向与双向A*搜索算法
设计模式学习(四):建造者模式
二叉树介绍 ~ 概念、存储结构、性质
Linux下的 /etc/profile、/etc/bashrc、~/.bash_profile、~/.bashrc 笔记2208300059
【每日一题】三个无重叠子数组的最大和
[附源码]计算机毕业设计JAVA影院售票系统
opencv4.x安装成功后,Pycharm导入无函数提示(但是可以正常使用imread、imshow等函数)
- 原文地址:https://blog.csdn.net/weixin_46713695/article/details/125482831