-
latex公式及表格识别
公式识别
今天发现了一个好东西,就是如果想复制人家文章里的公式到自己的latex中,可以使用下面的网站
https://www.latexlive.com/home##
登陆后,就可以直接截图,然后就可以得到对应的latex代码
例如

直接截图复制到那个在线网站上
 可以看到这个结果可比自己一个一个敲要快多了
有了上面的这个,我想做另外一个事,是否有让latex识别表格的插件呢,
我搜了一下,这个是有的,是excel2latex啦安装excel2latex
参考
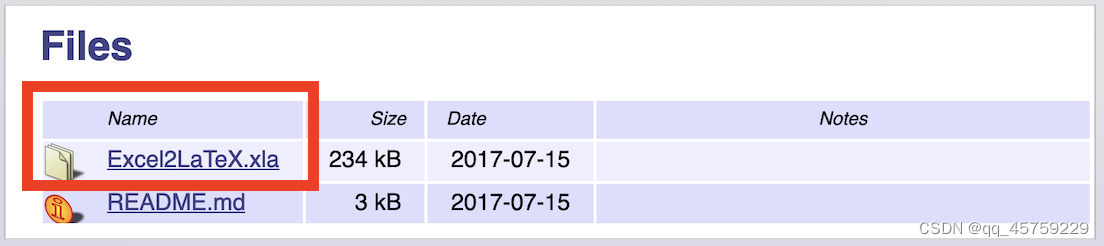
https://www.bilibili.com/read/cv14219721/首先去官网下载
https://ctan.org/tex-archive/support/excel2latex/
 然后打开excel
进入
 然后找到刚才下载的xla文件,点击确定就可以安装了
如果安装成功,那么最终的结果如下

使用教程
首先准备一个excel表格,如下
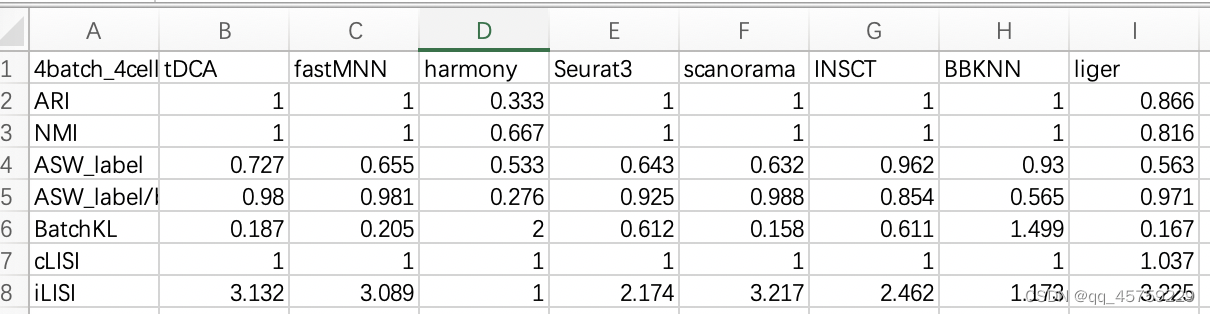 首先选择表格的全部数据
然后选择加载项里对应的那么个表格,如下
 这里就可以生成
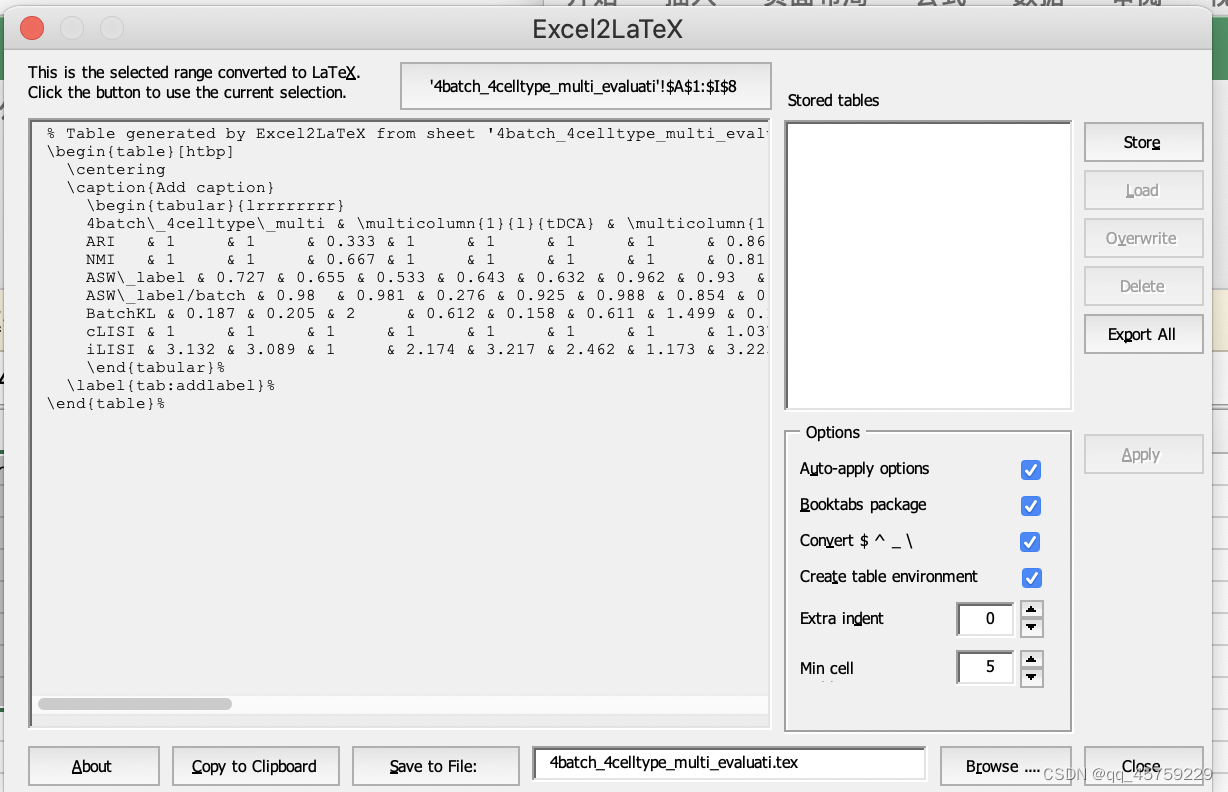 点击Copy to Clipboard就可以复制到粘贴板了,保存到文件好像是报错了,不过我也不需要这个,
不过这里有个小bug,现在复制得到的latex代码其实格式是乱的,直接复制到texstudio中

这个太乱了,直接运行会报错,需要值前自己换一下行
,或者可以先把代码复制到typora中,然后从typora中把latex代码复制到texstudio中

这里可以看到,格式变好了,最终就可以运行texstudio看表格的结果了,下面是我的测试代码% 例5 \documentclass{article} \usepackage{booktabs} \usepackage{multirow} \title{My First Document} \author{Mingliang Zhang} \date{\today} \begin{document} \maketitle Hello,$$f(x)=3x^2+x-1$$This is a message. \begin{table}[htbp] \centering \caption{Add caption} \begin{tabular}{lrrrrrrrr} 4batch\_4celltype\_multi & \multicolumn{1}{l}{tDCA} & \multicolumn{1}{l}{fastMNN} & \multicolumn{1}{l}{harmony} & \multicolumn{1}{l}{Seurat3} & \multicolumn{1}{l}{scanorama} & \multicolumn{1}{l}{INSCT} & \multicolumn{1}{l}{BBKNN} & \multicolumn{1}{l}{liger} \\ ARI & 1 & 1 & 0.333 & 1 & 1 & 1 & 1 & 0.866 \\ NMI & 1 & 1 & 0.667 & 1 & 1 & 1 & 1 & 0.816 \\ ASW\_label & 0.727 & 0.655 & 0.533 & 0.643 & 0.632 & 0.962 & 0.93 & 0.563 \\ ASW\_label/batch & 0.98 & 0.981 & 0.276 & 0.925 & 0.988 & 0.854 & 0.565 & 0.971 \\ BatchKL & 0.187 & 0.205 & 2 & 0.612 & 0.158 & 0.611 & 1.499 & 0.167 \\ cLISI & 1 & 1 & 1 & 1 & 1 & 1 & 1 & 1.037 \\ iLISI & 3.132 & 3.089 & 1 & 2.174 & 3.217 & 2.462 & 1.173 & 3.225 \\ \end{tabular}% \label{tab:addlabel}% \end{table}% % Table generated by Excel2LaTeX from sheet '4batch_4celltype_multi_evaluati' \begin{table}[htbp] \centering \caption{Add caption} \begin{tabular}{lrrrrrrrr} & \multicolumn{1}{l}{tDCA} & \multicolumn{1}{l}{fastMNN} & \multicolumn{1}{l}{harmony} & \multicolumn{1}{l}{Seurat3} & \multicolumn{1}{l}{scanorama} & \multicolumn{1}{l}{INSCT} & \multicolumn{1}{l}{BBKNN} & \multicolumn{1}{l}{liger} \\ ARI & 1 & 1 & 0.333 & 1 & 1 & 1 & 1 & 0.866 \\ NMI & 1 & 1 & 0.667 & 1 & 1 & 1 & 1 & 0.816 \\ ASW\_label & 0.727 & 0.655 & 0.533 & 0.643 & 0.632 & 0.962 & 0.93 & 0.563 \\ ASW\_label/batch & 0.98 & 0.981 & 0.276 & 0.925 & 0.988 & 0.854 & 0.565 & 0.971 \\ BatchKL & 0.187 & 0.205 & 2 & 0.612 & 0.158 & 0.611 & 1.499 & 0.167 \\ cLISI & 1 & 1 & 1 & 1 & 1 & 1 & 1 & 1.037 \\ iLISI & 3.132 & 3.089 & 1 & 2.174 & 3.217 & 2.462 & 1.173 & 3.225 \\ \end{tabular}% \label{tab:addlabel}% \end{table}% % Table generated by Excel2LaTeX from sheet 'Sheet1' \begin{table}[htbp] \centering \caption{Add caption} \begin{tabular}{c|lrrrrrrrrr} \toprule \multicolumn{2}{c}{\multirow{2}[4]{*}{\textbf{Method}}} & \multicolumn{3}{c}{\textbf{Dataset 1}} & \multicolumn{3}{c}{\textbf{Dataset 2}} & \multicolumn{3}{c}{\textbf{Dataset 3}} \\ \cmidrule{3-11} \multicolumn{2}{c}{} & \multicolumn{1}{c}{RMSE} & \multicolumn{1}{c}{MAE} & \multicolumn{1}{c}{ACC} & \multicolumn{1}{c}{RMSE} & \multicolumn{1}{c}{MAE} & \multicolumn{1}{c}{ACC} & \multicolumn{1}{c}{RMSE} & \multicolumn{1}{c}{MAE} & \multicolumn{1}{c}{ACC} \\ \midrule \multirow{2}[2]{*}{Non-Graph} & MLP & & & & & & & & & \\ & SVR & & & & & & & & & \\ \midrule \multirow{5}[2]{*}{Graph} & GCN & & & & & & & & & \\ & GAT & & & & & & & & & \\ & RGCN & & & & & & & & & \\ & GIN & & & & & & & & & \\ & ChebNet & & & & & & & & & \\ \midrule \midrule \textbf{Proposed} & \textbf{ABC} & & & & & & & & & \\ \bottomrule \end{tabular}% \label{tab:addlabel}% \end{table}% % Table generated by Excel2LaTeX from sheet 'Sheet1' \begin{table}[htbp] \centering \setlength{\abovecaptionskip}{2pt}% \setlength{\belowcaptionskip}{10pt}% \caption{It is a table.} \begin{tabular}{c|lrrrrrrrrr} \bottomrule %\toprule \multicolumn{2}{c}{\multirow{2}[4]{*}{\textbf{Method}}} & \multicolumn{3}{c}{\textbf{Dataset 1}} & \multicolumn{3}{c}{\textbf{Dataset 2}} & \multicolumn{3}{c}{\textbf{Dataset 3}} \\ \cmidrule(r){3-5} \cmidrule(r){6-8} \cmidrule{9-11} \multicolumn{2}{c}{} & \multicolumn{1}{c}{RMSE} & \multicolumn{1}{c}{MAE} & \multicolumn{1}{c}{ACC} & \multicolumn{1}{c}{RMSE} & \multicolumn{1}{c}{MAE} & \multicolumn{1}{c}{ACC} & \multicolumn{1}{c}{RMSE} & \multicolumn{1}{c}{MAE} & \multicolumn{1}{c}{ACC} \\ \hline \multirow{2}[2]{*}{Non-Graph} & MLP & & & & & & & & & \\ & SVR & & & & & & & & & \\ \hline \multirow{5}[2]{*}{Graph} & GCN & & & & & & & & & \\ & GAT & & & & & & & & & \\ & RGCN & & & & & & & & & \\ & GIN & & & & & & & & & \\ & ChebNet & & & & & & & & & \\ \hline \hline \textbf{Proposed} & \textbf{ABC} & & & & & & & & & \\ \toprule %\bottomrule \end{tabular}% \label{tab:addlabel}% \end{table}% % Table generated by Excel2LaTeX from sheet '4batch_4celltype_multi_evaluati'\begin{table}[htbp] \centering \caption{Add caption} \begin{tabular}{lrrrrrrrr} 4batch\_4celltype\_multi & \multicolumn{1}{l}{tDCA} & \multicolumn{1}{l}{fastMNN} & \multicolumn{1}{l}{harmony} & \multicolumn{1}{l}{Seurat3} & \multicolumn{1}{l}{scanorama} & \multicolumn{1}{l}{INSCT} & \multicolumn{1}{l}{BBKNN} & \multicolumn{1}{l}{liger} \\ ARI & 1 & 1 & 0.333 & 1 & 1 & 1 & 1 & 0.866 \\ NMI & 1 & 1 & 0.667 & 1 & 1 & 1 & 1 & 0.816 \\ ASW\_label & 0.727 & 0.655 & 0.533 & 0.643 & 0.632 & 0.962 & 0.93 & 0.563 \\ ASW\_label/batch & 0.98 & 0.981 & 0.276 & 0.925 & 0.988 & 0.854 & 0.565 & 0.971 \\ BatchKL & 0.187 & 0.205 & 2 & 0.612 & 0.158 & 0.611 & 1.499 & 0.167 \\ cLISI & 1 & 1 & 1 & 1 & 1 & 1 & 1 & 1.037 \\ iLISI & 3.132 & 3.089 & 1 & 2.174 & 3.217 & 2.462 & 1.173 & 3.225 \\ \end{tabular}% \label{tab:addlabel}%\end{table}% \end{document}- 1
- 2
- 3
- 4
- 5
- 6
- 7
- 8
- 9
- 10
- 11
- 12
- 13
- 14
- 15
- 16
- 17
- 18
- 19
- 20
- 21
- 22
- 23
- 24
- 25
- 26
- 27
- 28
- 29
- 30
- 31
- 32
- 33
- 34
- 35
- 36
- 37
- 38
- 39
- 40
- 41
- 42
- 43
- 44
- 45
- 46
- 47
- 48
- 49
- 50
- 51
- 52
- 53
- 54
- 55
- 56
- 57
- 58
- 59
- 60
- 61
- 62
- 63
- 64
- 65
- 66
- 67
- 68
- 69
- 70
- 71
- 72
- 73
- 74
- 75
- 76
- 77
- 78
- 79
- 80
- 81
- 82
- 83
- 84
- 85
- 86
- 87
- 88
- 89
- 90
- 91
- 92
- 93
- 94
- 95
- 96
- 97
- 98
- 99
- 100
- 101
- 102
- 103
- 104
- 105
- 106
最终结果如下


可以看到达到了我想要的结果 -
相关阅读:
【毕业设计】深度学习人脸识别系统 - python opencv 卷积神经网络
【优化调度】基于改进遗传算法的公交车调度排班优化的研究与实现(Matlab代码实现)
阿里云票据凭证识别
Docker容器文件目录
设计模式——工厂模式
壁挂式SIP网络有源音柱 SIP广播音柱 支持私有协议软件广播
tomcat读取文件路径问题
[附源码]java毕业设计学生宿舍管理系统
springboot幼儿园书刊信息管理系统毕业设计源码141858
AB实验--科学增长
- 原文地址:https://blog.csdn.net/qq_45759229/article/details/125430770