-
应用回归分析,第4章,思考与练习,答案,r语音代码
4.8
- library(readr)
- data4_3 <- read_csv("data4.3.csv")
- View(data4_3)
- lm4.3<-lm(y~x,data = data4_3)
- summary(lm4.3)
Call:
lm(formula = y ~ x, data = data4_3)

Residuals:
   Min     1Q Median     3Q    Max
-499.8 -152.5  -25.1  174.7  452.1

Coefficients:
              Estimate Std. Error t value Pr(>|t|)
(Intercept) -6.481e+02  1.182e+02  -5.485  6.6e-06 ***
x            8.467e-02  4.882e-03  17.342  < 2e-16 ***
---
Signif. codes:  0 ‘***’ 0.001 ‘**’ 0.01 ‘*’ 0.05 ‘.’ 0.1 ‘ ’ 1

Residual standard error: 247.6 on 29 degrees of freedom
Multiple R-squared:  0.912,	Adjusted R-squared:  0.909
F-statistic: 300.7 on 1 and 29 DF,  p-value: < 2.2e-16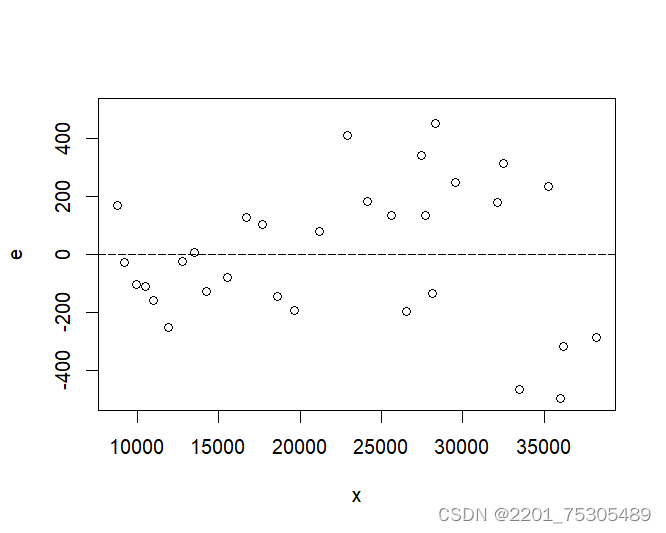
- e<-resid(lm4.3)
- attach(data4_3)
- plot(x,e,ylim =
-
相关阅读:
C++ STL使用技巧
devops学习(三) K8环境部署jenkins
Springboot企业人力资源管理系统的开发与数据挖掘t1law计算机毕业设计-课程设计-期末作业-毕设程序代做
Ribbon饥饿加载
孩子近视家里的灯如何选择?盘点眼科医生分享的护眼台灯
php伪协议 [ACTF2020 新生赛]Include1
前端学习笔记一.Flex布局与VUE2中vuex的使用
nginx重写与防盗链
《算法导论》第19章-斐波那契堆 引入&& 19.1 斐波那契堆结构
ubuntu18.04 ros 安装 gazebo9
- 原文地址:https://blog.csdn.net/2201_75305489/article/details/137924659