-
微信小程序使用echarts实现条形统计图功能
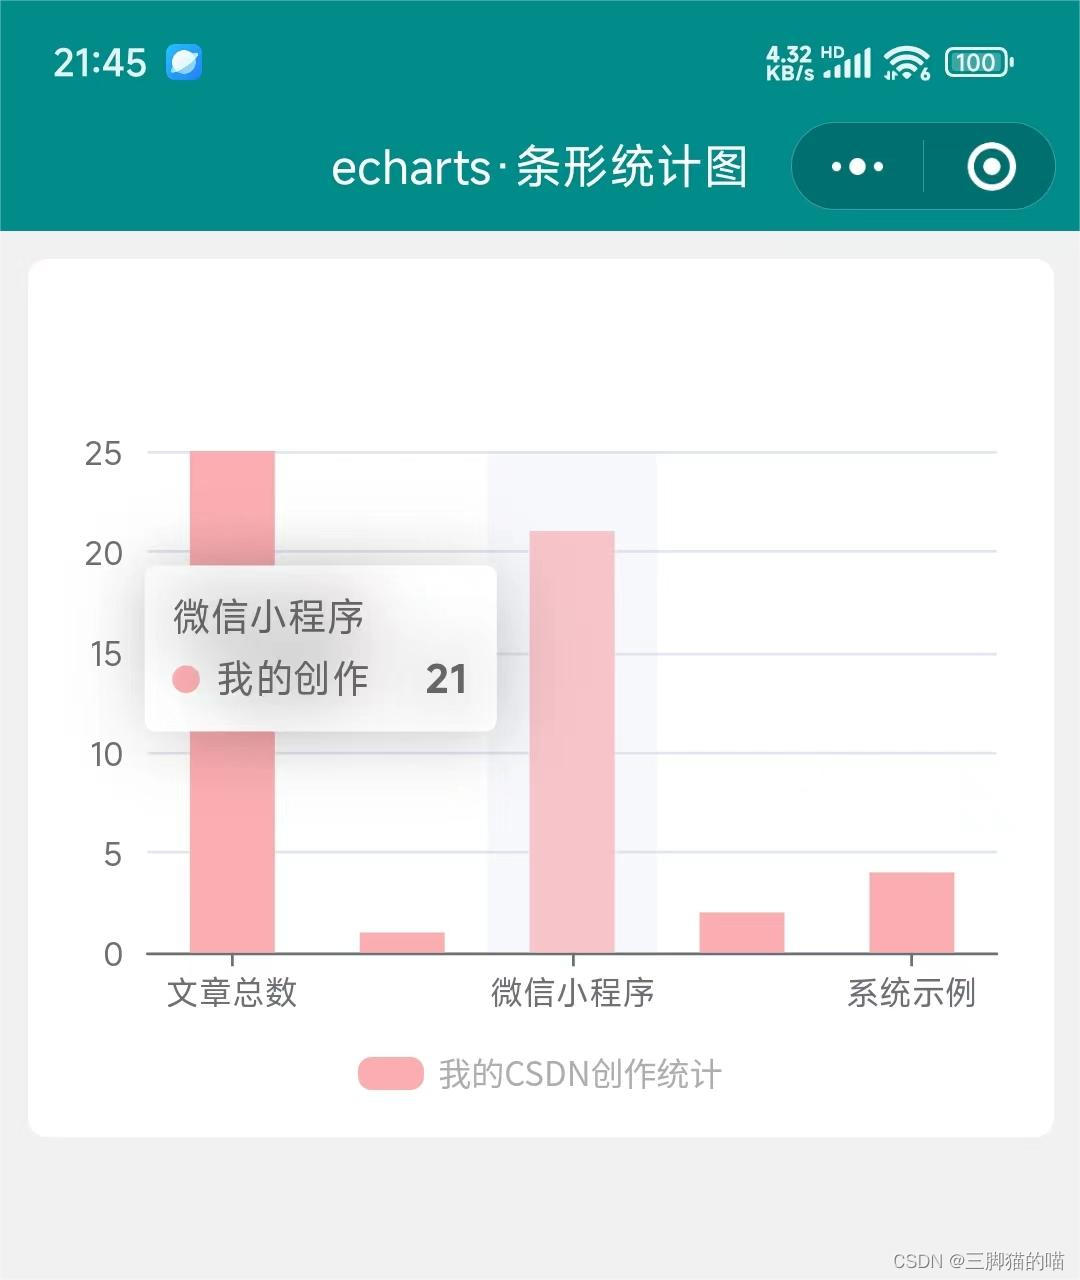
微信小程序使用echarts组件实现条形统计图功能
使用echarts实现在微信小程序中统计图的功能,其实很简单,只需要简单的两步就可以实现啦,具体思路如下:
- 引入echarts组件
- 调用相应的函数方法
由于需要引入echarts组件,代码行数较多,无法在此粘贴,需要的友友们可以进我的主页,进行免费的资源下载,具体的实现结果截图如下:

echarts组件代码较多,components文件夹的内容可在我主页的资源免费下载或者可前往echarts官网下载呦,引入的路径一定要正确。具体关于pages文件夹的代码如下:
1、wxml代码:
<view class="charts-box"> <view style="height: 500rpx;"> <ec-canvas canvas-id="mychart-bar" ec="{{spread}}">ec-canvas> view> <view class="charts-title"> <view class="charts-pot">view> <view>{{title}}view> view> view>- 1
- 2
- 3
- 4
- 5
- 6
- 7
- 8
- 9
2、wxss代码:
page { background-color: #f1f1f1; } .charts-box { background-color: white; margin: 20rpx; border-radius: 15rpx; padding: 20rpx; } .charts-title { display: flex; flex-direction: row; font-size: 24rpx; align-items: center; justify-content: center; color: rgb(173, 173, 173); margin: 30rpx 0 10rpx; } .charts-pot { width: 46rpx; height: 24rpx; background-color: #fcadb0; margin-right: 10rpx; border-radius: 10rpx; margin-top: 2rpx; }- 1
- 2
- 3
- 4
- 5
- 6
- 7
- 8
- 9
- 10
- 11
- 12
- 13
- 14
- 15
- 16
- 17
- 18
- 19
- 20
- 21
- 22
- 23
- 24
- 25
- 26
- 27
- 28
- 29
3、js代码:
import * as echarts from '../../components/ec-canvas/echarts.min'; let chart = null; Page({ /** * 页面的初始数据 */ data: { title:'我的CSDN创作统计', spread: { onInit: initChart } }, }) function initChart(canvas, width, height, dpr) { chart = echarts.init(canvas, null, { width: width, height: height, devicePixelRatio: dpr // new }); canvas.setChart(chart); let option = { tooltip: { trigger: 'axis', axisPointer: { type: 'shadow' } }, grid: { left: '3%', right: '3%', bottom: '0%', containLabel: true }, xAxis: [{ type: 'category', data: ['文章总数', '经典界面', '微信小程序', '学习经验', '系统示例'], axisTick: { alignWithLabel: true } }], yAxis: [{ type: 'value' }], series: [{ name: '我的创作', type: 'bar', barWidth: '50%', data: [25, 1, 21, 2, 4], itemStyle: { color: '#fcadb0' } }] }; chart.setOption(option); return chart; }- 1
- 2
- 3
- 4
- 5
- 6
- 7
- 8
- 9
- 10
- 11
- 12
- 13
- 14
- 15
- 16
- 17
- 18
- 19
- 20
- 21
- 22
- 23
- 24
- 25
- 26
- 27
- 28
- 29
- 30
- 31
- 32
- 33
- 34
- 35
- 36
- 37
- 38
- 39
- 40
- 41
- 42
- 43
- 44
- 45
- 46
- 47
- 48
- 49
- 50
- 51
- 52
- 53
- 54
- 55
- 56
- 57
- 58
- 59
4、json代码:
{ "component": true, "navigationBarTitleText": "echarts·条形统计图", "navigationBarBackgroundColor": "#008B8B", "usingComponents": { "ec-canvas":"../../components/ec-canvas/ec-canvas" } }- 1
- 2
- 3
- 4
- 5
- 6
- 7
- 8
我这里简单绘制的条形统计图,如需要其他的统计图,可自行学习或者进我主页,将分享更多内容呦~
小编创作不易,口干舌燥,可以的话,请我喝杯水吧!欢迎各位的批评指导呦~ -
相关阅读:
GaussDB OLTP 云数据库配套工具DAS
reportportal 集成 robotframework 自动化执行及结果可视化
NR modulation 1
如何在Puppeteer中设置User-Agent来绕过京东的反爬虫机制?
软件测试Day7|数据库Mysql
【浅尝C++】STL第三弹=>list常用接口使用示例/list底层结构探索/list模拟实现代码详解
配置交换机将Log发送到日志服务器
JAVA编程规范之二方库依赖
.net Core .net6 Cookie加Jwt认证 同时生效
Open3D(C++) SVD分解求两个点云的变换矩阵
- 原文地址:https://blog.csdn.net/weixin_45465881/article/details/138171153
