-
Prometheus + Grafana 搭建监控仪表盘
目标要求
1、需要展现的仪表盘:
SpringBoot或JVM仪表盘
Centos物理机服务器(实际为物理分割的虚拟服务器)仪表盘
2、展现要求:
探索Prometheus + Grafana搭建起来的展示效果,尽可能展示能展示的部分。一、下载软件包
- 监控系统核心:prometheus-2.45.0.linux-amd64.tar
下载地址:https://github.com/prometheus/prometheus/releases/download/v2.45.0/prometheus-2.45.0.linux-amd64.tar.gz - 测试用节点导出器:node_exporter-1.6.0.linux-amd64.tar
下载地址:https://github.com/prometheus/node_exporter/releases/download/v1.6.0/node_exporter-1.6.0.linux-amd64.tar.gz - Grafana仪表盘:
下载地址:
https://dl.grafana.com/enterprise/release/grafana-enterprise-10.4.1.linux-amd64.tar.gz
二、安装及编写启动脚本
-
新建工作目录prometheus,将下载的软件包移动到目录下。
-
使用“tar -zxvf 软件包包名”命令逐步接下软件包。
如: tar -zxvf prometheus-2.45.0.linux-amd64.tar.gz -
在每个解压后的软件工作目录,新建start.sh脚本,按下方表格填入启动命令。保存后,赋予脚本执行权限“chmod +x start.sh”。
关闭方式 启动脚本 prometheus kill -9 nohup ./prometheus --web.enable-lifecycle > log.log 2>&1 & grafana 同上 nohup ./bin/grafana-server>>./log.log & node 同上 nohup ./node_exporter --web.listen-address=:9101 > node_log.log 2>&1 & 三、启动测试
分别执行目录下的启动脚本:start.sh
- promethesu的UI默认访问地址:ip:9090,正常访问效果图如下:

- grafana默认访问地址:ip:3000,正常访问效果图如下:

初始账户密码:admin/admin
初次安装需要修改密码,按照提示修改即可。登录后正常访问效果图如下:

四、JAVA应用添加Prometheus支持
JAVA版本:JDK17,Springboot版本:3.1.2
- 配置pom文件:
org.springframework.boot spring-boot-starter-actuator 2.1.4.RELEASE io.micrometer micrometer-core 1.11.1 io.micrometer micrometer-registry-prometheus 1.11.1 - 1
- 2
- 3
- 4
- 5
- 6
- 7
- 8
- 9
- 10
- 11
- 12
- 13
- 14
- 15
- 16
- 配置application.yml文件
# prometheus 配置 management: metrics: # 下面选项建议打开,以监控 http 请求的 P99/P95 等,具体的时间分布可以根据实际情况设置 distribution: sla: http: server: requests: 1ms,5ms,10ms,50ms,100ms,200ms,500ms,1s,5s tags: application: ${spring.application.name} endpoints: prometheus: enabled: true web: base-path: /monitor exposure: include: "prometheus"- 1
- 2
- 3
- 4
- 5
- 6
- 7
- 8
- 9
- 10
- 11
- 12
- 13
- 14
- 15
- 16
- 17
- 18
五、Prometheus配置文件
- 修改Prometheus.yml配置文件如下图:

scrape_configs: # The job name is added as a label `job=` to any timeseries scraped from this config. - job_name: "prometheus" # metrics_path defaults to '/metrics' # scheme defaults to 'http'. # 添加应用节点 - job_name: 'application' metrics_path: '/monitor/prometheus' scrape_interval: 15s file_sd_configs: - files: ['./exporter_config/application_target.json'] # 添加硬件节点 - job_name: 'node' scrape_interval: 15s file_sd_configs: - files: ['./exporter_config/node.json'] static_configs: - targets: ["localhost:9090"] - 1
- 2
- 3
- 4
- 5
- 6
- 7
- 8
- 9
- 10
- 11
- 12
- 13
- 14
- 15
- 16
- 17
- 18
- 19
- 20
- 在prometheus创建目录“exporter_config”
- 在exporter_config分别创建应用配置文件"application_target.json ",节点配置文件“node.json”。如下图

- 填写文件内容如下:
10.0.0.1:100x代表节点、jar包所在的机器ip以及端口号
application_target.json
[ { "targets": [ "10.0.0.1:1001" ], "labels": { "instance": "10.0.0.1:1001", "service": "jar名", "ip": "10.0.0.1", "nodeType": "application" } } ]- 1
- 2
- 3
- 4
- 5
- 6
- 7
- 8
- 9
- 10
- 11
- 12
- 13
- 14
node.json
[ { "targets":[ "10.0.0.1:1001" ], "labels":{ "instance":"模拟硬件节点", "job":"模拟硬件节点job", "ip": "10.0.0.1", "nodeType":"device" } } ]- 1
- 2
- 3
- 4
- 5
- 6
- 7
- 8
- 9
- 10
- 11
- 12
- 13
- 使用postman调用热重启接口,重启prometheus,如下图,10.0.0.1:9090代表prometheus安装IP端口。返回200则代表已发送重启命令。

- 访问Prometheus,地址:ip:9090:,如下图:

- 第六步正常则代表prometheus监控系统,已将JAVA应用程序导出器、node节点导出器纳入监控。其它情况则代表未纳入监控,需要检查使得纳入Prometheus监控再往下推进。
六、Grafana配置中文与组件兼容
- 修改defaults.ini文件,文件处于./conf目录下,修改前建议备份。
- 当前版本某些组件默认不启用,导致一些开源的仪表盘显示为空。故需要配置启用

- 汉化。

七、Grafana连接Prometheus
- 添加新数据源

- 配置
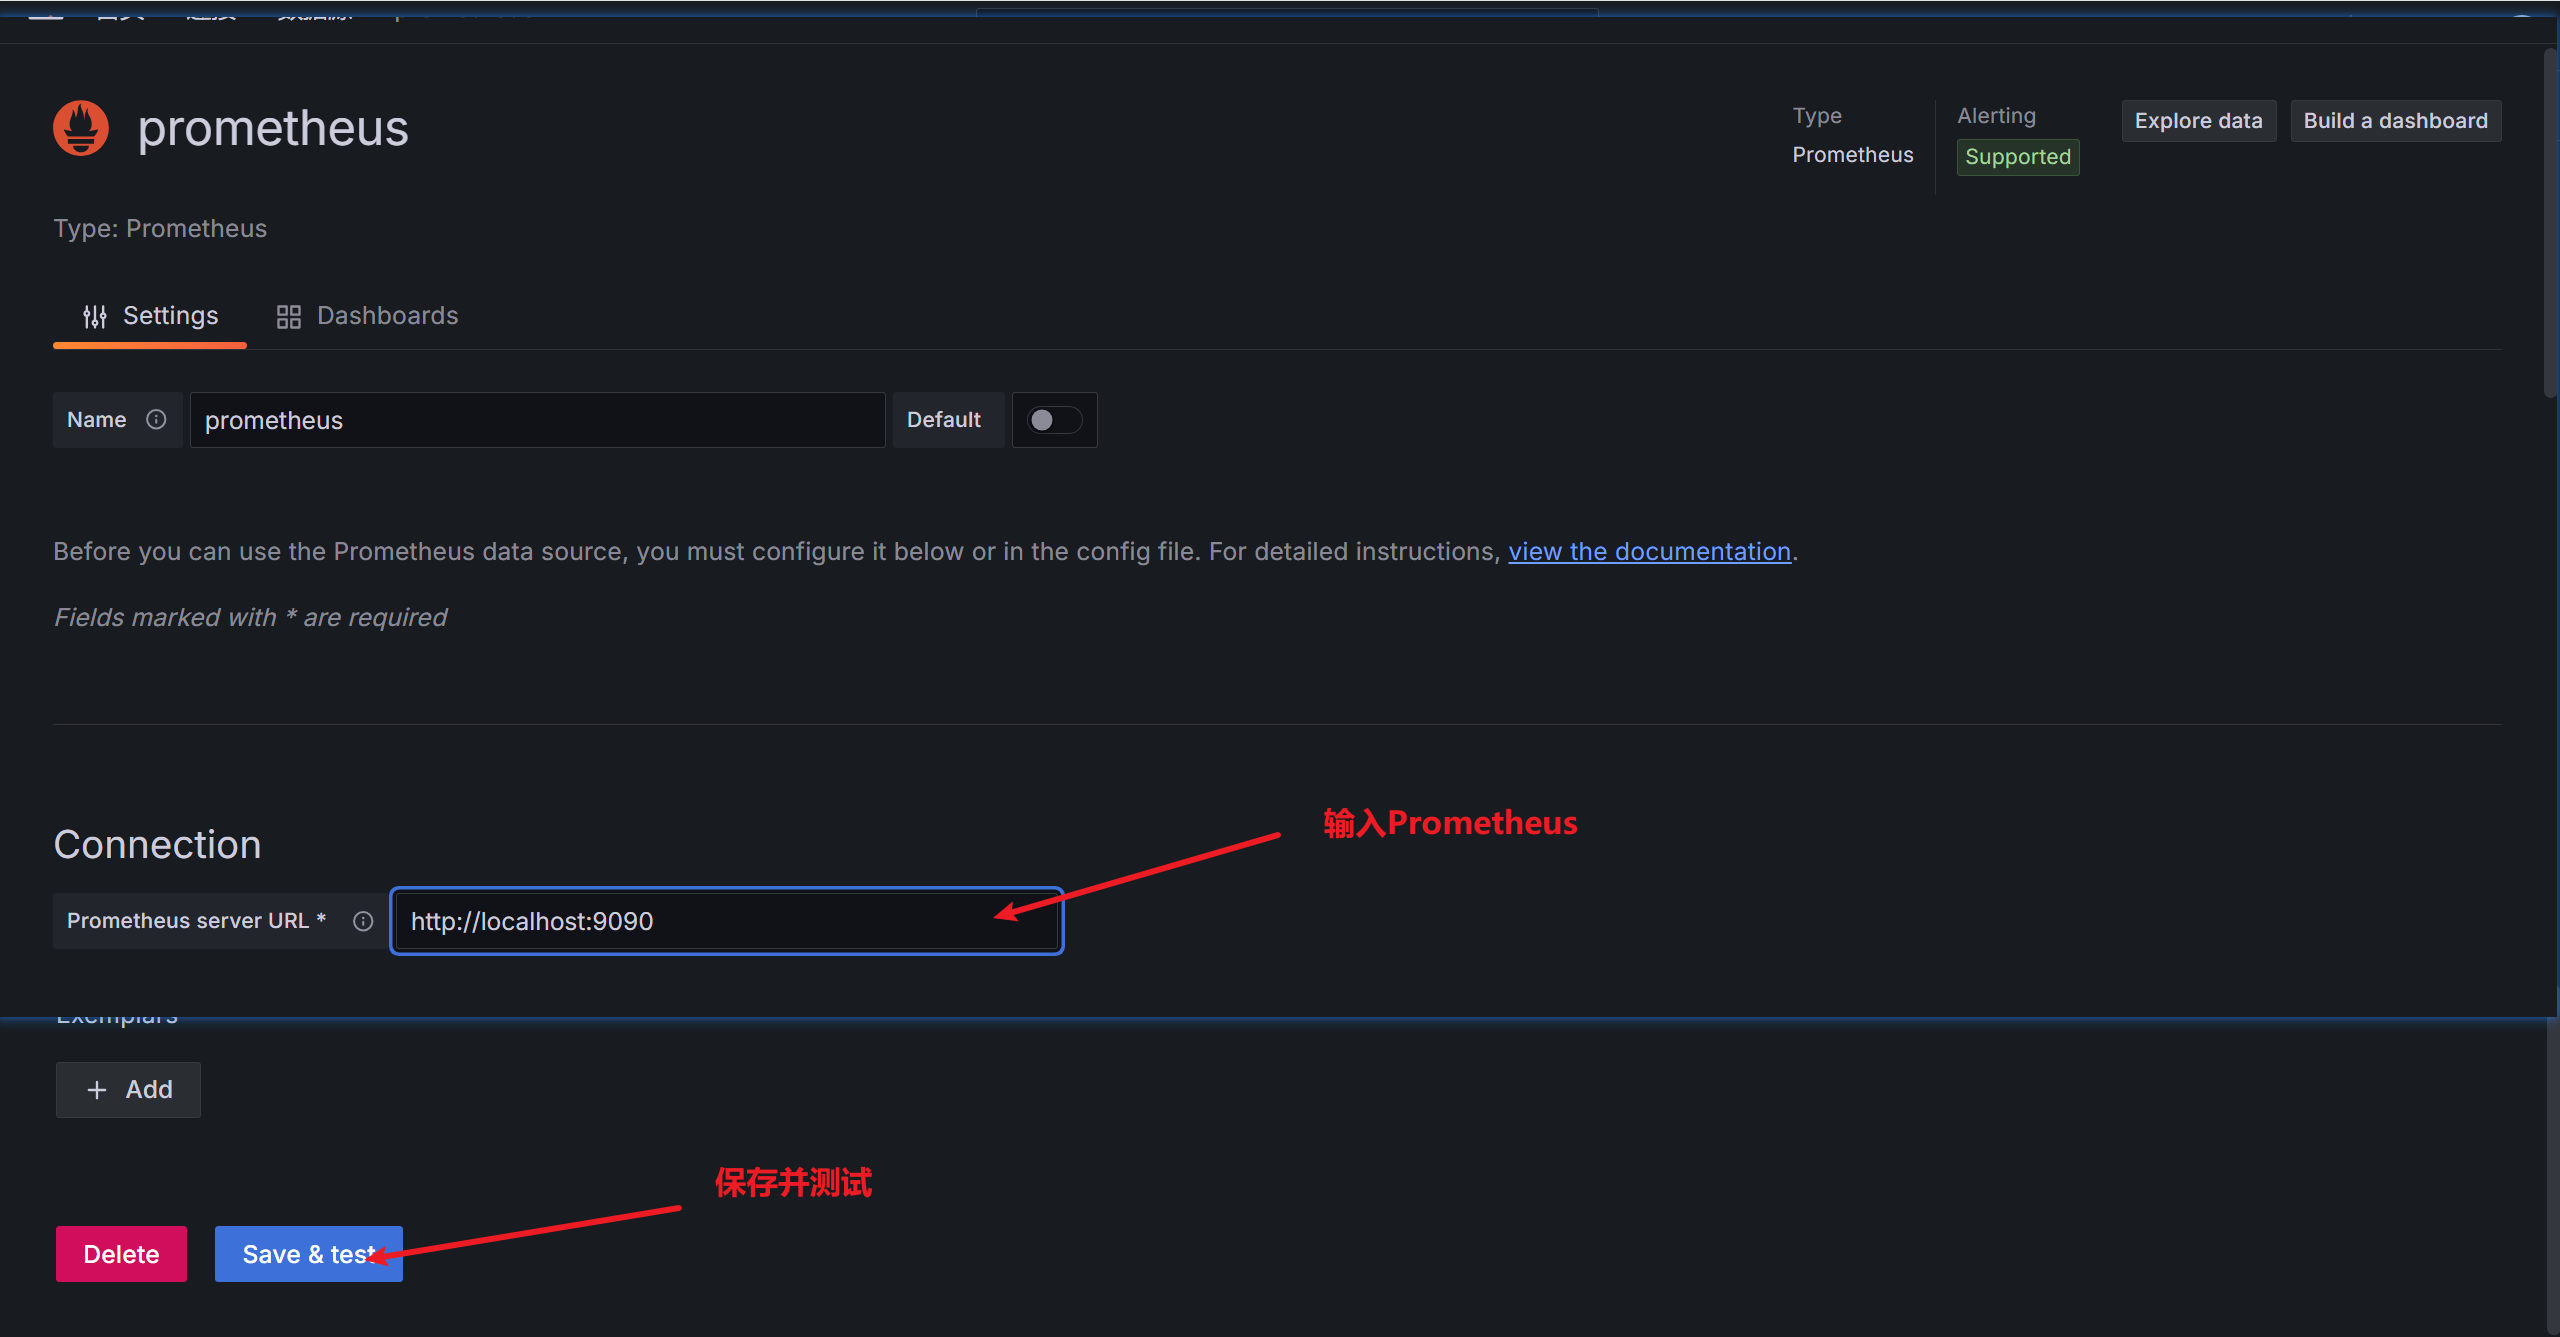
- 成功如图

八、在Grafana配置仪表盘(Dashboard)
1、导入常见的Dashboard
任意Dashboard,无需数据源可导入,但是展示的内容是默认值。
同类型的多个监控目标,例如node监控,可以在适配的Dashboard切换观看。- 选择导入

- 到官方查看官方提供的仪表盘

- 选择一个需要的仪表盘

- 下载仪表盘的json配置

- 打开下载的json文件,粘贴到第二步对应的方框内。

- 即可生成node常用应用程序的仪表盘

- 导入JVM及其它仪表盘:重复步骤1

3、自定义仪表盘(就是点点点)
- 新建仪表盘

- 添加可视化面板

- 选择数据源

- 自定义仪表盘

- 保存或应用

- 效果如图:添加其它可视化表重复1~6步

- 监控系统核心:prometheus-2.45.0.linux-amd64.tar
-
相关阅读:
线稿图视频制作补充(调整视频亮度、对比度;删除无用文件)
腾讯云和阿里云4核8G云服务器多少钱一年和1个月费用对比
3D深度相机---结构光
LED点灯
WebRTC系列-网络之带宽估计和码率估计(2)接收端带宽估计
极客日报:微信封杀英雄联盟手游小程序;初代微软Xbox之父向AMD道歉;Visual Studio 2022于11月8日发布
Bandzip下载(好用的解压缩工具)
【K8S】集群中部署nginx应用 运行手写yaml文件报错排查过程
vs code 好用的插件
实现map和set
- 原文地址:https://blog.csdn.net/qq_41307963/article/details/137860396
