-
【python】直方图正则化详解和示例
直方图正则化(Histogram Normalization)是一种图像增强技术,目的是改变图像的直方图以改善图像的质量。具体来说,它通过将图像的直方图调整为指定的形状,以增强图像的对比度和亮度。
直方图正则化的基本步骤如下:
计算输入图像的直方图和累积分布函数(CDF)。
计算正则化的直方图,使其具有相同的CDF。
使用正则化的直方图来映射输入图像的像素值。
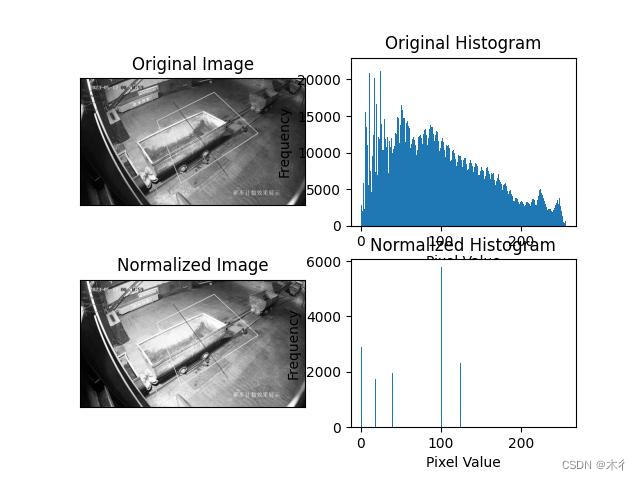
下面是一个使用Python和OpenCV库实现直方图正则化的示例代码:import cv2 import numpy as np import matplotlib.pyplot as plt # 加载图像 image = cv2.imread('11111.jpg', cv2.IMREAD_GRAYSCALE) # 计算输入图像的直方图和累积分布函数(CDF) hist, bins = np.histogram(image.flatten(), 256, [0, 256]) cdf = hist.cumsum() cdf_normalized = cdf * hist.max() / cdf.max() # 计算正则化的直方图 cdf_m = np.ma.masked_equal(cdf, 0) cdf_m = (cdf_m - cdf_m.min()) * 255 / (cdf_m.max() - cdf_m.min()) cdf_final = (cdf_m - cdf_m.min()) * hist.max() / (cdf_m.max() - cdf_m.min()) # 使用正则化的直方图来映射输入图像的像素值 image_normalized = np.interp(image.flatten(), bins[:-1], cdf_final) image_normalized = image_normalized.reshape(image.shape) # 显示原始图像、正则化后的图像和直方图 plt.subplot(2, 2, 1) plt.imshow(image, cmap='gray') plt.title('Original Image') plt.xticks([]), plt.yticks([]) plt.subplot(2, 2, 2) plt.hist(image.flatten(), 256, [0, 256]) plt.title('Original Histogram') plt.xlabel('Pixel Value') plt.ylabel('Frequency') plt.subplot(2, 2, 3) plt.imshow(image_normalized, cmap='gray') plt.title('Normalized Image') plt.xticks([]), plt.yticks([]) plt.subplot(2, 2, 4) plt.hist(image_normalized.flatten(), 256, [0, 256]) plt.title('Normalized Histogram') plt.xlabel('Pixel Value') plt.ylabel('Frequency') #plt.show() plt.savefig("11111gray.jpg")- 1
- 2
- 3
- 4
- 5
- 6
- 7
- 8
- 9
- 10
- 11
- 12
- 13
- 14
- 15
- 16
- 17
- 18
- 19
- 20
- 21
- 22
- 23
- 24
- 25
- 26
- 27
- 28
- 29
- 30
- 31
- 32
- 33
- 34
- 35
- 36
- 37
- 38
- 39
- 40
- 41
- 42
- 43
- 44
- 45
- 46
这段代码首先加载一张灰度图像,并计算其直方图和CDF。然后,它计算正则化的直方图,并使用该直方图来映射输入图像的像素值。最后,它显示原始图像、正则化后的图像和两个直方图。
效果图如下所示:
-
相关阅读:
js中的call() apply() bind()的用法
基于51单片机的信号发生器设计
宜搭,怎么在公式编辑中计算百分比的和?
JAVA一点就到家外卖订餐系统计算机毕业设计Mybatis+系统+数据库+调试部署
axios下载csv文件下载-功能实现
Java之HashMap中getOrDefault()方法具有什么功能呢?
Linux·内核编译错误
【网安神器篇】——Whatweb指纹识别工具
车载通信架构 —— 传统车内通信网络发展回顾
uniapp cors错误
- 原文地址:https://blog.csdn.net/qq_22734027/article/details/134520734
