-
Istio Arch-Overview
Simply put
Istio is a popular open-source service mesh framework that aims to provide a platform for service-to-service communication, monitoring, and security. It is built on top of the Envoy proxy, which is a lightweight, high-performance proxy server that can be used to route traffic to different services within a microservices architecture.
The architecture of Istio consists of several components that work together to provide a seamless way for services to communicate with each other. The key components of Istio are:
- Istio-sidecar : This is a sidecar proxy that is injected into each service in the microservices architecture. It intercepts incoming traffic and routes it to the appropriate service. The Istio-sidecar also performs traffic management, rate limiting, and security features.
- Istio-control plane : This is a set of components that manage the configuration of the service mesh. The control plane components include the Istio-config-server , which provides a centralized configuration store for the entire mesh, and the Istio-policy-server , which enforces policies on the traffic flowing through the mesh.
- Envoy proxy : This is the core component of Istio that provides the underlying infrastructure for routing and intercepting traffic. It is responsible for forwarding requests to the appropriate service and handling security features such as SSL termination, authentication, and rate limiting.
Istio Arch-observability
https://istio.io/latest/docs/concepts/observability/
Observability
Observability refers to the ability to monitor and analyze the behavior of distributed systems. In the context of Istio, observability refers to the collection and visualization of data that provides insights into the performance, reliability, and security of the system.
Istio provides several tools for observability, including metrics, distributed traces, and access logs.
Metrics
Metrics are a key concept in observability. Metrics are used to measure the performance and resource usage of the system. In Istio, metrics can be divided into three categories: proxy-level metrics, service-level metrics, and control plane metrics.
Proxy-level metrics are collected by the Istio proxy, which sits between the client and the service. These metrics provide information about the requests and responses being handled by the proxy, as well as the proxy’s own resource usage.
Service-level metrics are collected by the Istio service, and provide information about the requests and responses being handled by the service itself.
Control plane metrics are collected by the Istio control plane components, such as the Istio-sidecar, and provide information about the health and status of the Istio system.
Proxy-level metrics
Proxy-level metrics are collected by the Istio proxy, which sits between the client and the service. These metrics provide information about the requests and responses being handled by the proxy, as well as the proxy’s own resource usage.
Here are some examples of proxy-level metrics:
istio_request_count: The total number of requests received by the proxy.istio_request_duration: The average duration of requests received by the proxy.istio_request_size: The average size of requests received by the proxy.istio_response_size: The average size of responses sent by the proxy.istio_proxy_cpu_seconds_total: The total amount of CPU time consumed by the proxy.istio_proxy_memory_usage_bytes: The amount of memory consumed by the proxy.
Service-level metrics
Service-level metrics are collected by the Istio service, and provide information about the requests and responses being handled by the service itself.
Here are some examples of service-level metrics:
istio_request_count: The total number of requests received by the service.istio_request_duration: The average duration of requests received by the service.istio_request_size: The average size of requests received by the service.istio_response_size: The average size of responses sent by the service.istio_service_cpu_seconds_total: The total amount of CPU time consumed by the service.istio_service_memory_usage_bytes: The amount of memory consumed by the service.
Control plane metrics
Control plane metrics are collected by the Istio control plane components, such as the Istio-sidecar, and provide information about the health and status of the Istio system.
Here are some examples of control plane metrics:
istio_config_validation_errors_total: The total number of validation errors detected by Istio for the configuration of the service.istio_proxy_config_validation_errors_total: The total number of validation errors detected by Istio for the configuration of the proxy.istio_upstream_latency_seconds: The average latency of requests being sent to the upstream service by the proxy.
Distributed traces
Distributed traces are another important aspect of observability in Istio. Distributed traces are used to track the flow of requests between different services in a distributed system, and provide a high-level view of the performance and reliability of the system.
Istio provides a distributed trace system called the Istio-Tracing tool, which allows you to collect and visualize distributed traces.
Access logs
Access logs are a type of observability data that provides information about the requests and responses being handled by the system. Istio provides built-in support for access logs, which can be configured to log requests and responses to a file or syslog.
In summary, Istio provides several tools for observability, including metrics, distributed traces, and access logs. These tools provide insights into the performance, reliability, and security of the system, and can be used to troubleshoot issues and optimize the behavior of the system.
Extensibility
WebAssembly (Wasm) is used in Istio to provide extensibility, allowing users to add their own custom logic to the Istio service mesh. This enables users to enforce policies, collect telemetry, and perform payload mutations, among other things.
The goals of the Istio Wasm sandbox are:
- Efficiency : An extension should have low latency and minimal impact on CPU and memory usage.
- Function : An extension should be able to enforce policy, collect telemetry, and perform payload mutations according to user-defined requirements.
- Isolation : Programming errors or crashes in one extension should not impact other extensions.
- Configuration : Extensions can be dynamically configured using an API that aligns with other Istio APIs.
- Operator-friendly : Extensions can be canaried and deployed with different failure modes, such as log-only, fail-open, or fail-close.
- Developer-friendly : Extensions can be written in multiple programming languages to accommodate different developer preferences.
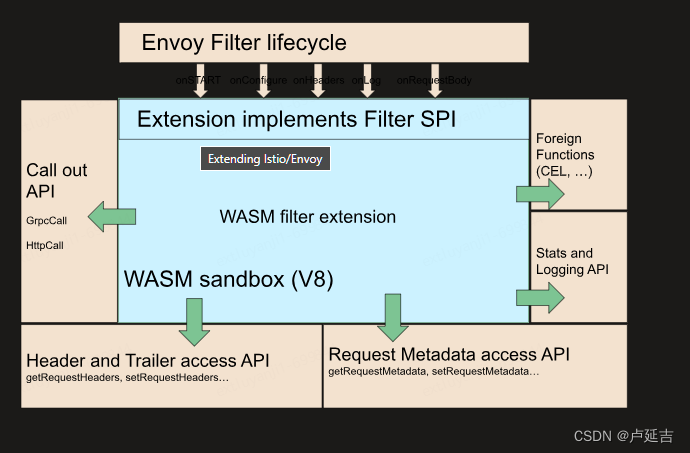
The high-level architecture of Istio’s WebAssembly sandbox includes the following components:
- Filter Service Provider Interface (SPI) : This interface allows developers to build Proxy-Wasm plugins for filters. Filters are a type of Envoy extension that allow users to modify the behavior of Envoy proxies.
- Sandbox : The sandbox is built on top of the V8 Wasm runtime and is embedded within the Envoy proxy. It provides a secure and isolated environment for running WebAssembly plugins.
- Host APIs : These APIs provide access to functionality within the Envoy proxy, such as headers, trailers, and metadata. They allow WebAssembly plugins to interact with the request and response data flowing through the proxy.
- Call out APIs : These APIs allow WebAssembly plugins to make gRPC and HTTP calls to external services. This enables plugins to collect additional data or make decisions based on information from external sources.
- Stats and Logging APIs : These APIs allow WebAssembly plugins to emit metrics and log data for monitoring and troubleshooting purposes.
With the Istio Wasm sandbox, users can extend the functionality of the Istio service mesh in a flexible and customizable manner, providing additional control and insights into their distributed systems.
-
相关阅读:
uniapp 分享到朋友圈
完美!字节3-1级别大佬把《数据结构与算法》讲透了,带源码笔记
[python 刷题] 128 Longest Consecutive Sequence
华为od机考题目-带空白字符的字符串匹配
如何手写一个js工具库?同时发布到npm上
枚举 蓝桥oj DNA序列修正
Pytorch实现线性回归
JS模块化——CommonJS AMD CMD UMD ES6 Module 比较
碎碎念日常——一个反思日记
(零基础学习)Neo4j+Spring boot 自行定义属性
- 原文地址:https://blog.csdn.net/weixin_38233104/article/details/134374196