-
springboot actuator 常用接口
概述
微服务作为一项在云中部署应用和服务的新技术是当下比较热门话题,而微服务的特点决定了功能模块的部署是分布式的,运行在不同的机器上相互通过服务调用进行交互,业务流会经过多个微服务的处理和传递,在这种框架下,微服务的监控显得尤为重要。
而Actuator正是Spring Boot提供的对应用系统的监控和管理的集成功能,可以查看应用配置的详细信息,例如自动化配置信息、创建的Spring beans信息、系统环境变量的配置信以及Web请求的详细信息等。如果使用不当或者一些不经意的疏忽,可能造成信息泄露等严重的安全隐患。
Actuator使用
Actuator应用监控使用只需要添加spring-boot-starter-actuator依赖即可,如下:
            org.springframework.boot
            spring-boot-starter-actuator
可以在application.properties中指定actuator的访问路径,如指定路径为/monitor:
management.context-path=/monitor
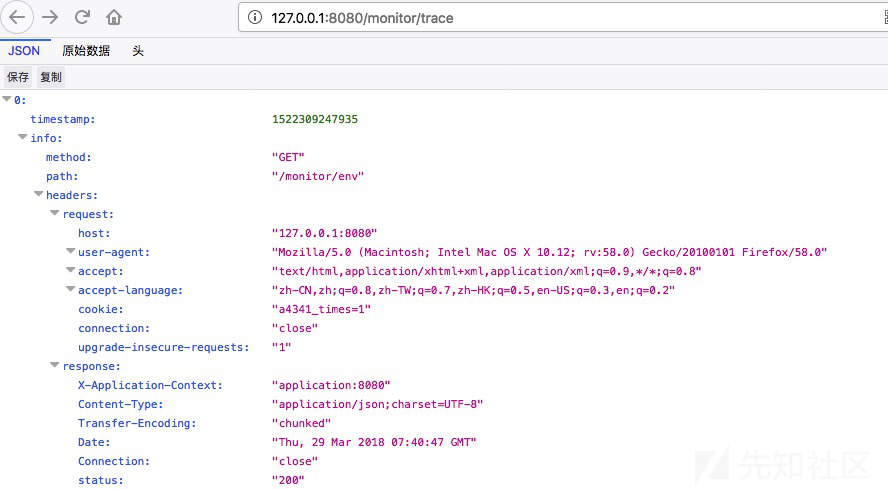
此时,运行示例,访问/monitor/env即可查看系统环境变量的配置信息,之后再访问/monitor/trace即可查看所有Web请求的详细信息,包括请求方法、路径、时间戳以及请求和响应的头信息甚至cookie信息,如图:
Actuator监控分成两类:原生端点和用户自定义扩展端点,原生的主要有:
路径 描述 /autoconfig 提供了一份自动配置报告,记录哪些自动配置条件通过了,哪些没通过 /beans 描述应用程序上下文里全部的Bean,以及它们的关系 /env 获取全部环境属性 /configprops 描述配置属性(包含默认值)如何注入Bean /dump 获取线程活动的快照 /health 报告应用程序的健康指标,这些值由HealthIndicator的实现类提供 /info 获取应用程序的定制信息,这些信息由info打头的属性提供 /mappings 描述全部的URI路径,以及它们和控制器(包含Actuator端点)的映射关系 /metrics 报告各种应用程序度量信息,比如内存用量和HTTP请求计数 /shutdown 关闭应用程序,要求endpoints.shutdown.enabled设置为true /trace 提供基本的HTTP请求跟踪信息(时间戳、HTTP头等) 安全措施
如果上述请求接口不做任何安全限制,安全隐患显而易见。实际上Spring Boot也提供了安全限制功能。比如要禁用/env接口,则可设置如下:
endpoints.env.enabled= false
如果只想打开一两个接口,那就先禁用全部接口,然后启用需要的接口:
endpoints.enabled = false
endpoints.metrics.enabled = true
另外也可以引入spring-boot-starter-security依赖
- <dependency>
- <groupId>org.springframework.boot</groupId>
- <artifactId>spring-boot-starter-security</artifactId>
- </dependency>
在application.properties中指定actuator的端口以及开启security功能,配置访问权限验证,这时再访问actuator功能时就会弹出登录窗口,需要输入账号密码验证后才允许访问。
- management.port=8099
- management.security.enabled=true
- security.user.name=admin
- security.user.password=admin
安全建议
在使用Actuator时,不正确的使用或者一些不经意的疏忽,就会造成严重的信息泄露等安全隐患。在代码审计时如果是springboot项目并且遇到actuator依赖,则有必要对安全依赖及配置进行复查。也可作为一条规则添加到黑盒扫描器中进一步把控。
安全的做法是一定要引入security依赖,打开安全限制并进行身份验证。同时设置单独的Actuator管理端口并配置不对外网开放。参考:spring-boot-starter-actuator监控接口详解 - 简书
spring-boot-starter-actuator功能简介
根据应用依赖和配置自动创建出来的监控和管理端点。通过这些端点,我们可以实时获取系统应用的各项监控指标。
spring-boot-starter-actuator功能集成
第一步:添加相关jar包依赖
- <!--srping-boot-actuator-->
- <dependency>
- <groupId>org.springframework.boot</groupId>
- <artifactId>spring-boot-starter-actuator</artifactId>
- </dependency>
第二步:application.properties 配置Spring-Boot-Actuator配置
- #spring-boot-actuator配置
- #开放所有的web Endpoints
- management.endpoints.web.exposure.include=*
第三步:获取监控端点详细信息和效果展示
通过访问:http://localhost:8082/actuator,获取监控端点详细信息

字符串格式化:
- {
- "_links":{
- "self":{
- "href":"http://localhost:8082/actuator",
- "templated":false
- },
- "archaius":{
- "href":"http://localhost:8082/actuator/archaius",
- "templated":false
- },
- "auditevents":{
- "href":"http://localhost:8082/actuator/auditevents",
- "templated":false
- },
- "beans":{
- "href":"http://localhost:8082/actuator/beans",
- "templated":false
- },
- "caches-cache":{
- "href":"http://localhost:8082/actuator/caches/{cache}",
- "templated":true
- },
- "caches":{
- "href":"http://localhost:8082/actuator/caches",
- "templated":false
- },
- "health":{
- "href":"http://localhost:8082/actuator/health",
- "templated":false
- },
- "health-component":{
- "href":"http://localhost:8082/actuator/health/{component}",
- "templated":true
- },
- "health-component-instance":{
- "href":"http://localhost:8082/actuator/health/{component}/{instance}",
- "templated":true
- },
- "conditions":{
- "href":"http://localhost:8082/actuator/conditions",
- "templated":false
- },
- "configprops":{
- "href":"http://localhost:8082/actuator/configprops",
- "templated":false
- },
- "env":{
- "href":"http://localhost:8082/actuator/env",
- "templated":false
- },
- "env-toMatch":{
- "href":"http://localhost:8082/actuator/env/{toMatch}",
- "templated":true
- },
- "info":{
- "href":"http://localhost:8082/actuator/info",
- "templated":false
- },
- "loggers":{
- "href":"http://localhost:8082/actuator/loggers",
- "templated":false
- },
- "loggers-name":{
- "href":"http://localhost:8082/actuator/loggers/{name}",
- "templated":true
- },
- "heapdump":{
- "href":"http://localhost:8082/actuator/heapdump",
- "templated":false
- },
- "threaddump":{
- "href":"http://localhost:8082/actuator/threaddump",
- "templated":false
- },
- "metrics-requiredMetricName":{
- "href":"http://localhost:8082/actuator/metrics/{requiredMetricName}",
- "templated":true
- },
- "metrics":{
- "href":"http://localhost:8082/actuator/metrics",
- "templated":false
- },
- "scheduledtasks":{
- "href":"http://localhost:8082/actuator/scheduledtasks",
- "templated":false
- },
- "httptrace":{
- "href":"http://localhost:8082/actuator/httptrace",
- "templated":false
- },
- "mappings":{
- "href":"http://localhost:8082/actuator/mappings",
- "templated":false
- },
- "refresh":{
- "href":"http://localhost:8082/actuator/refresh",
- "templated":false
- },
- "features":{
- "href":"http://localhost:8082/actuator/features",
- "templated":false
- },
- "service-registry":{
- "href":"http://localhost:8082/actuator/service-registry",
- "templated":false
- }
- }
- }
spring-boot-starter-actuator模块生成的原生监控端点,分为三大类:
- 应用配置类:获取应用程序中加载的应用配置、环境变量、自动化配置报告等与SpringBoot应用密切相关的配置类信息;这类端点可以帮助我们获取一系列关于Spring应用配置内容的详细报告,比如自动化配置的报告、Bean创建的报告、环境属性的报告等。
- 度量指标类:获取应用程序运行过程中用于监控的度量指标,比如内存信息、线程池信息、HTTP请求统计等;
- 操作监控类:提供了对应用的关闭等操作类功能;
以上三类监控端点的详细信息,下面我们详细来说明。
第四步:监控端点信息描述
应用配置类:默认启用
- /autoconfig: 该端点用来获取应用的自动化配置报告,其中包括所有自动化配置的候选项,同时列举了每个候选项是否满足自动化配置的各个先决条件。该端点可以帮助我们方便地找到一些自动化配置为什么没有生效的具体原因。报告内容分为两部分,如下:
(1)positiveMatches中返回的是条件匹配成功的自动化配置;
(2)negativeMathches中返回的是条件匹配不成功的自动化配置。 - /beans: 该端点用来获取应用上下文中创建的所有Bean。包含的具体信息如下:
(1)bean:Bean的名称;
(2)scope: Bean的作用域;
(3)type: Bean的Java类型;
(4)resource: class文件的具体路径;
(5)dependencies: 依赖的Bean的名称; - /configprops: 该端点用来获取应用中配置的属性信息报告。我们可以通过该报告来看到各个属性的配置路径,比如我们要关闭端点,就可以使用endpoints.configprops.enabled=false来完成设置。
- /env: 该端点用来获取应用所有可用的环境属性报告,具体包括环境变量、JVM属性、应用的配置属性、命令行中的参数。通过该端点返回的信息,我们可以看到当前应用加载的配置信息,可以结合@ConfigurationProperties注解将它们引入到应用程序中使用。对于一些敏感属性信息,比如在属性名中包含password,secret,key这些关键词,在返回的时候会使用*来替换。
- /mappings: 该端点用来返回所有Spring MVC的控制器映射关系报告。返回的信息有:
(1)bean属性: 标识该映射关系的请求处理器;
(2)method属性:标识该映射关系的具体处理类和处理函数; - /info:该端点用来返回一些应用自定义的信息。默认情况下,该端点只会返回一个空的JSON内容。我们可以在application.properties配置文件中设置一些以info为前缀的属性配置信息,就能看到效果。
度量指标类:默认启用
- /metrics: 该端点用来返回当前应用的各类重要度量指标,比如内存信息、线程信息、垃圾回收信息等。具体信息包含如下:
(1)系统信息:包括处理器数量processors、运行时间uptime和instance.uptime、系统平均负载systemload.average;
(2)mem.*: 内存概要信息,包括分配给应用的总内存数量以及当前空闲的内存数量,这些信息来自java.lang.Runtime;
(3)heap.*: 堆内存使用情况。这些信息来自java.lang.management.MemoryMXBean接口中getHeapMemoryUsage方法获取的java.lang.management.MemoryUsage;
(4)nonheap.*: 非堆内存使用情况。这些信息来自java.lang.management.MemoryMXBean接口中getNonHeapMemoryUsage方法获取java.lang.management.MemoryUsage;
(5)threads.*: 线程使用情况,包括线程数、守护线程(daemon)、线程峰值(peak)等,这些信息来自java.lang.management.ThreadMXBean;
(6)classes.*: 应用加载和卸载的类统计,这些信息来自java.lang.managemeng.ClassLoadingMXBean;
(7)gc.*: 垃圾收集器的详细信息,包括垃圾回收次数gc.ps_scavenge.count、垃圾回收消耗时间gc.ps_scavenge.time、标记-清除算法的次数gc.ps_marksweep.count、标记-清除算法的消耗时间gc.ps_marksweep.time。这些信息来自java.lang.management.GarbageCollectorMXBean;
(8)httpsessions.*: Tomcat容器的会话使用情况。包括最大会话数httpsessions.max和活跃会话数httpsessions.active。该度量指标信息仅在引入嵌入式Tomcat作为应用容器的时候才会提供;
(9)gauge.*: HTTP请求的性能指标之一,它主要用来反映一个绝对值。
(10)counter.*: HTTP请求的性能指标之一,它主要作为计数器来使用,记录了增加量和减少量。
报告的具体内容如下: - /health: 该端点用来获取应用的各类健康指标信息。在spring-boot-starter-actuator模块中自带实现了一些常用资源的健康指标检测器,这些健康指标检测器都是通过HealthIndicator接口实现,并且会根据依赖关系的引入实现自动化配置。常见的一些健康指标检测器如下:
(1)DiskSpaceHealthIndicator: 低磁盘空间检测;
(2)DataSourceHealthIndicator: 检测DataSource的链接是否成功;
(3)MongoHealthIndicator: 检测Mongo数据库是否可用;
(4)RabbitHealthIndicator: 检测Rabbit服务器是否可用;
(5)RedisHealthIndicator: 检测Redis服务器是否可用;
(6)SolrHealthIndicator: 检测Solr服务器是否可用;
我们也可用通过实现HealthIndicator接口来自定义自己的健康指标检测器;
报告的具体内容如下: - /dump: 该端点用来暴露程序运行中的线程信息。它使用java.lang.management.ThreadMXBean的dumpAllThreads方法来返回所有含有同步信息的活动线程详情;
- /trace: 该端点用来返回基本的HTTP跟踪信息。默认情况下,跟踪信息的存储采用org.springframework.boot.actuate.trace.InMemoryTraceRepository实现的内存方式,始终保留最近的100条请求记录。
操作控制类:需要通过属性配置来开启操作
1./shutdown: 该端点用来实现关闭应用的远程操作,需要配置属性endpoints.shutdown.enable=true才能实现。该操作非常危险,不建议使用。
-
相关阅读:
python LeetCode 刷题记录 104
RabbitMQ中的手动应答和自动应答
关于京东购物车中一个店铺加购商品过多时,店铺名称不被划走的实现
redis主从
用openhub无法拿到query里面信息对象的文本
Docker 容器生命周期:创建、启动、暂停与停止
【软件测试从0到1】第四篇:测试分类
分类分析|KNN分类模型及其Python实现
内网Jenkins 部署.net(dotnet)项目
Linux简单命令学习
- 原文地址:https://blog.csdn.net/Maxiao1204/article/details/134044651
