-
SpringBoot + Prometheus + Grafana 打造可视化监控
SpringBoot + Prometheus + Grafana 打造可视化监控
常见的监控组件搭配

安装Prometheus
- 本次使用的是windows版本进行学习测试
- prometheus-2.46.0.windows-amd64
下载地址
- prometheus.io/download/

解压后修改prometheus.yml文件,配置数据采集的目标信息
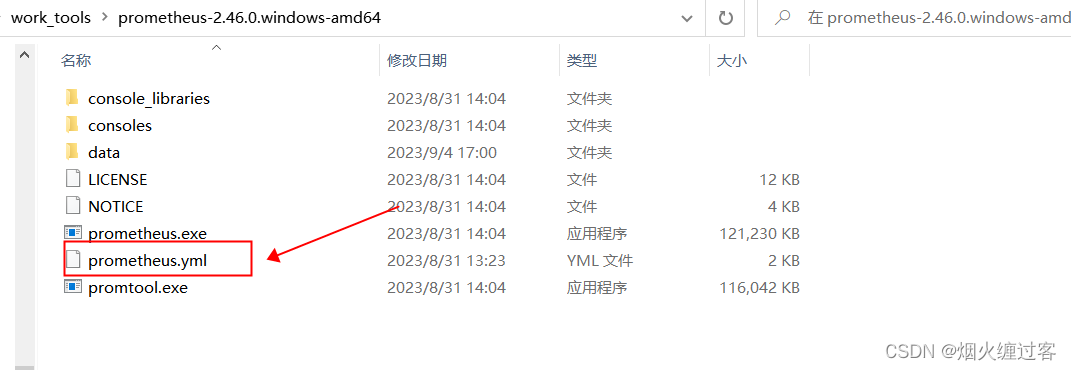
# my global config global: scrape_interval: 15s # Set the scrape interval to every 15 seconds. Default is every 1 minute. evaluation_interval: 15s # Evaluate rules every 15 seconds. The default is every 1 minute. # scrape_timeout is set to the global default (10s). # Alertmanager configuration alerting: alertmanagers: - static_configs: - targets: # - alertmanager:9093 # Load rules once and periodically evaluate them according to the global 'evaluation_interval'. rule_files: # - "first_rules.yml" # - "second_rules.yml" # A scrape configuration containing exactly one endpoint to scrape: # Here it's Prometheus itself. scrape_configs: # The job name is added as a label `job=` to any timeseries scraped from this config. - job_name: "prometheus" # metrics_path defaults to '/metrics' # scheme defaults to 'http'. # 暴露路径 metrics_path: /actuator/prometheus static_configs: # SpringBoot的ip和端口 - targets: ["localhost:10086"]- 1
- 2
- 3
- 4
- 5
- 6
- 7
- 8
- 9
- 10
- 11
- 12
- 13
- 14
- 15
- 16
- 17
- 18
- 19
- 20
- 21
- 22
- 23
- 24
- 25
- 26
- 27
- 28
- 29
- 30
- 31
- 32
启动prometheus
prometheus.exe
prometheus.exe–config.file=prometheus.yml

访问promethus
http://localhost:9090/


要修改Prometheus的拉取数据时间为1秒,您需要调整Prometheus的配置文件中的以下两个参数:
- scrape_interval:这个参数指定了Prometheus拉取目标配置的时间间隔,单位为秒。您可以将该参数设置为1秒,以实现每秒拉取一次数据。
- scrape_timeout:这个参数指定了Prometheus拉取目标配置的超时时间,单位为秒。您需要将该参数设置为大于1秒的值,以确保Prometheus有足够的时间完成对目标配置的拉取。
以下是一个示例Prometheus配置文件(通常命名为prometheus.yml),其中将scrape_interval设置为1秒:
global: scrape_interval: 1s scrape_configs: - job_name: 'example_job' scrape_interval: 1s scrape_timeout: 5s static_configs: - targets: ['example.com:8080']- 1
- 2
- 3
- 4
- 5
- 6
- 7
- 8
- 9
在上述示例中,scrape_interval被设置为1秒,而scrape_timeout被设置为5秒。请根据您的实际需求进行调整。
请注意,将拉取时间间隔设置为非常短的时间可能会导致Prometheus对目标配置产生大量的请求,从而可能对目标应用程序造成负面影响。因此,在实际应用中,请根据目标应用程序的性能和可接受的网络负载进行适当的调整。
安装Grafana
下载地址
https://mirrors.huaweicloud.com/grafana/
- grafana-enterprise-8.4.1.windows-amd64

解压后如图

启动grafana
双击:grafana-server.exe

访问grafana
默认账号:admin
默认密码:admin登录地址
http://127.0.0.1:3000/login

搭建SpringBoot项目
引入依赖
<dependency> <groupId>org.springframework.bootgroupId> <artifactId>spring-boot-starter-actuatorartifactId> dependency> <dependency> <groupId>io.micrometergroupId> <artifactId>micrometer-registry-prometheusartifactId> dependency> <dependency> <groupId>io.prometheusgroupId> <artifactId>simpleclient_pushgatewayartifactId> dependency>- 1
- 2
- 3
- 4
- 5
- 6
- 7
- 8
- 9
- 10
- 11
- 12
- 13
- 14
- 15
- 16
- 17
全部
<project xmlns="http://maven.apache.org/POM/4.0.0" xmlns:xsi="http://www.w3.org/2001/XMLSchema-instance" xsi:schemaLocation="http://maven.apache.org/POM/4.0.0 https://maven.apache.org/xsd/maven-4.0.0.xsd"> <modelVersion>4.0.0modelVersion> <parent> <groupId>org.springframework.bootgroupId> <artifactId>spring-boot-starter-parentartifactId> <version>2.3.2.RELEASEversion> <relativePath/> parent> <groupId>com.kanggroupId> <artifactId>grafana-prometheus-springbootartifactId> <version>0.0.1-SNAPSHOTversion> <name>grafana-prometheus-springbootname> <description>grafana-prometheus-springbootdescription> <properties> <java.version>1.8java.version> properties> <dependencies> <dependency> <groupId>org.springframework.bootgroupId> <artifactId>spring-boot-starter-data-elasticsearchartifactId> <exclusions> <exclusion> <artifactId>HdrHistogramartifactId> <groupId>org.hdrhistogramgroupId> exclusion> exclusions> dependency> <dependency> <groupId>org.springframework.bootgroupId> <artifactId>spring-boot-starter-webartifactId> dependency> <dependency> <groupId>org.projectlombokgroupId> <artifactId>lombokartifactId> <optional>trueoptional> dependency> <dependency> <groupId>org.springframework.bootgroupId> <artifactId>spring-boot-starter-testartifactId> <scope>testscope> dependency> <dependency> <groupId>com.alibabagroupId> <artifactId>fastjsonartifactId> <version>1.2.75version> dependency> <dependency> <groupId>org.apache.commonsgroupId> <artifactId>commons-lang3artifactId> <version>3.12.0version> dependency> <dependency> <groupId>org.hibernategroupId> <artifactId>hibernate-validatorartifactId> <version>5.3.5.Finalversion> dependency> <dependency> <groupId>mysqlgroupId> <artifactId>mysql-connector-javaartifactId> <version>8.0.16version> dependency> <dependency> <groupId>com.zaxxergroupId> <artifactId>HikariCPartifactId> <version>3.4.0version> dependency> <dependency> <groupId>com.baomidougroupId> <artifactId>mybatis-plus-boot-starterartifactId> <version>3.2.0version> dependency> <dependency> <groupId>com.baomidougroupId> <artifactId>mybatis-plus-generatorartifactId> <version>3.2.0version> dependency> <dependency> <groupId>org.freemarkergroupId> <artifactId>freemarkerartifactId> <version>2.3.28version> dependency> <dependency> <groupId>org.springframework.bootgroupId> <artifactId>spring-boot-starterartifactId> dependency> <dependency> <groupId>org.springframework.bootgroupId> <artifactId>spring-boot-starter-actuatorartifactId> dependency> <dependency> <groupId>io.micrometergroupId> <artifactId>micrometer-registry-prometheusartifactId> dependency> <dependency> <groupId>io.prometheusgroupId> <artifactId>simpleclient_pushgatewayartifactId> dependency> dependencies> <build> <plugins> <plugin> <groupId>org.springframework.bootgroupId> <artifactId>spring-boot-maven-pluginartifactId> <configuration> <excludes> <exclude> <groupId>org.projectlombokgroupId> <artifactId>lombokartifactId> exclude> excludes> configuration> plugin> plugins> build> project>- 1
- 2
- 3
- 4
- 5
- 6
- 7
- 8
- 9
- 10
- 11
- 12
- 13
- 14
- 15
- 16
- 17
- 18
- 19
- 20
- 21
- 22
- 23
- 24
- 25
- 26
- 27
- 28
- 29
- 30
- 31
- 32
- 33
- 34
- 35
- 36
- 37
- 38
- 39
- 40
- 41
- 42
- 43
- 44
- 45
- 46
- 47
- 48
- 49
- 50
- 51
- 52
- 53
- 54
- 55
- 56
- 57
- 58
- 59
- 60
- 61
- 62
- 63
- 64
- 65
- 66
- 67
- 68
- 69
- 70
- 71
- 72
- 73
- 74
- 75
- 76
- 77
- 78
- 79
- 80
- 81
- 82
- 83
- 84
- 85
- 86
- 87
- 88
- 89
- 90
- 91
- 92
- 93
- 94
- 95
- 96
- 97
- 98
- 99
- 100
- 101
- 102
- 103
- 104
- 105
- 106
- 107
- 108
- 109
- 110
- 111
- 112
- 113
- 114
- 115
- 116
- 117
- 118
- 119
- 120
- 121
- 122
- 123
- 124
- 125
- 126
- 127
- 128
- 129
- 130
- 131
- 132
- 133
- 134
- 135
- 136
yaml配置
server: port: 10086 tomcat: mbeanregistry: enabled: true max-connections: 150 threads: max: 50 min-spare: 15 # spring配置 spring: elasticsearch: uris: http://localhost:9200 application: name: "grafana-prometheus-springboot" datasource: url: jdbc:mysql://localhost:3306/goods_system?useUnicode=true&characterEncoding=utf8&useSSL=false&serverTimezone=Asia/Shanghai username: root password: root driver-class-name: com.mysql.cj.jdbc.Driver hikari: connection-timeout: 1000 # 获取连接超时时间 maximum-pool-size: 50 # 连接池中允许的最大连接数 minimum-idle: 5 # 连接池中保持的最小空闲连接数 idle-timeout: 30000 # 连接在池中保持空闲的最大时间,超过该时间将被释放 pool-name: grafana-hikari-pool # 连接池的名称 mybatis-plus: configuration: map-underscore-to-camel-case: true auto-mapping-behavior: full log-impl: org.apache.ibatis.logging.stdout.StdOutImpl default-statement-timeout: 1 mapper-locations: classpath*:mapper/**/*Mapper.xml global-config: db-config: logic-not-delete-value: 1 logic-delete-value: 0 # prometheus相关监控配置 management: metrics: export: prometheus: enabled: true step: 1m descriptions: true web: server: auto-time-requests: true endpoints: prometheus: id: springmetrics web: exposure: # 开放哪些指标端点 include: health,info,env,prometheus,metrics,httptrace,threaddump,heapdump,springmetrics,hikaricp,* endpoint: metrics: enabled: true- 1
- 2
- 3
- 4
- 5
- 6
- 7
- 8
- 9
- 10
- 11
- 12
- 13
- 14
- 15
- 16
- 17
- 18
- 19
- 20
- 21
- 22
- 23
- 24
- 25
- 26
- 27
- 28
- 29
- 30
- 31
- 32
- 33
- 34
- 35
- 36
- 37
- 38
- 39
- 40
- 41
- 42
- 43
- 44
- 45
- 46
- 47
- 48
- 49
- 50
- 51
- 52
- 53
- 54
- 55
- 56
- 57
- 58
- 59
- 60
- 61
- 62
结构图

示例:监控SpringBoot内置Tomcat线程池的情况
配置
server: port: 10086 tomcat: mbeanregistry: enabled: true max-connections: 150 threads: max: 50 min-spare: 15 # prometheus相关监控配置 management: metrics: export: prometheus: enabled: true step: 1m descriptions: true web: server: auto-time-requests: true endpoints: prometheus: id: springmetrics web: exposure: # 开放哪些指标端点 include: health,info,env,prometheus,metrics,httptrace,threaddump,heapdump,springmetrics,hikaricp,* endpoint: metrics: enabled: true- 1
- 2
- 3
- 4
- 5
- 6
- 7
- 8
- 9
- 10
- 11
- 12
- 13
- 14
- 15
- 16
- 17
- 18
- 19
- 20
- 21
- 22
- 23
- 24
- 25
- 26
- 27
- 28
- 29
访问/actuator/prometheus
http://localhost:10086/actuator/prometheus
# HELP tomcat_global_sent_bytes_total # TYPE tomcat_global_sent_bytes_total counter tomcat_global_sent_bytes_total{name="http-nio-10086",} 653223.0 # HELP hikaricp_connections_idle Idle connections # TYPE hikaricp_connections_idle gauge hikaricp_connections_idle{pool="grafana-hikari-pool",} 47.0 # HELP tomcat_global_error_total # TYPE tomcat_global_error_total counter tomcat_global_error_total{name="http-nio-10086",} 0.0 # HELP tomcat_servlet_request_seconds # TYPE tomcat_servlet_request_seconds summary tomcat_servlet_request_seconds_count{name="dispatcherServlet",} 2029.0 tomcat_servlet_request_seconds_sum{name="dispatcherServlet",} 77.433 # HELP system_cpu_count The number of processors available to the Java virtual machine # TYPE system_cpu_count gauge system_cpu_count 12.0 # HELP jvm_threads_live_threads The current number of live threads including both daemon and non-daemon threads # TYPE jvm_threads_live_threads gauge jvm_threads_live_threads 124.0 # HELP hikaricp_connections_timeout_total Connection timeout total count # TYPE hikaricp_connections_timeout_total counter hikaricp_connections_timeout_total{pool="grafana-hikari-pool",} 0.0 # HELP tomcat_threads_config_max_threads # TYPE tomcat_threads_config_max_threads gauge tomcat_threads_config_max_threads{name="http-nio-10086",} 50.0 # HELP process_cpu_usage The "recent cpu usage" for the Java Virtual Machine process # TYPE process_cpu_usage gauge process_cpu_usage 8.347234082417593E-4 # HELP hikaricp_connections_max Max connections # TYPE hikaricp_connections_max gauge hikaricp_connections_max{pool="grafana-hikari-pool",} 50.0 # HELP jvm_classes_loaded_classes The number of classes that are currently loaded in the Java virtual machine # TYPE jvm_classes_loaded_classes gauge jvm_classes_loaded_classes 10820.0 # HELP tomcat_sessions_active_max_sessions # TYPE tomcat_sessions_active_max_sessions gauge tomcat_sessions_active_max_sessions 0.0 # HELP jdbc_connections_min Minimum number of idle connections in the pool. # TYPE jdbc_connections_min gauge jdbc_connections_min{name="dataSource",} 5.0 # HELP hikaricp_connections_pending Pending threads # TYPE hikaricp_connections_pending gauge hikaricp_connections_pending{pool="grafana-hikari-pool",} 0.0 # HELP tomcat_sessions_rejected_sessions_total # TYPE tomcat_sessions_rejected_sessions_total counter tomcat_sessions_rejected_sessions_total 0.0 # HELP tomcat_global_request_seconds # TYPE tomcat_global_request_seconds summary tomcat_global_request_seconds_count{name="http-nio-10086",} 2028.0 tomcat_global_request_seconds_sum{name="http-nio-10086",} 80.738 # HELP jvm_gc_max_data_size_bytes Max size of old generation memory pool # TYPE jvm_gc_max_data_size_bytes gauge jvm_gc_max_data_size_bytes 2.751463424E9 # HELP jvm_gc_pause_seconds Time spent in GC pause # TYPE jvm_gc_pause_seconds summary jvm_gc_pause_seconds_count{action="end of major GC",cause="Metadata GC Threshold",} 1.0 jvm_gc_pause_seconds_sum{action="end of major GC",cause="Metadata GC Threshold",} 0.033 jvm_gc_pause_seconds_count{action="end of minor GC",cause="Metadata GC Threshold",} 1.0 jvm_gc_pause_seconds_sum{action="end of minor GC",cause="Metadata GC Threshold",} 0.005 jvm_gc_pause_seconds_count{action="end of minor GC",cause="Allocation Failure",} 3.0 jvm_gc_pause_seconds_sum{action="end of minor GC",cause="Allocation Failure",} 0.037 # HELP jvm_gc_pause_seconds_max Time spent in GC pause # TYPE jvm_gc_pause_seconds_max gauge jvm_gc_pause_seconds_max{action="end of major GC",cause="Metadata GC Threshold",} 0.0 jvm_gc_pause_seconds_max{action="end of minor GC",cause="Metadata GC Threshold",} 0.0 jvm_gc_pause_seconds_max{action="end of minor GC",cause="Allocation Failure",} 0.02 # HELP tomcat_sessions_active_current_sessions # TYPE tomcat_sessions_active_current_sessions gauge tomcat_sessions_active_current_sessions 0.0 # HELP tomcat_sessions_alive_max_seconds # TYPE tomcat_sessions_alive_max_seconds gauge tomcat_sessions_alive_max_seconds 0.0 # HELP hikaricp_connections_min Min connections # TYPE hikaricp_connections_min gauge hikaricp_connections_min{pool="grafana-hikari-pool",} 5.0 # HELP tomcat_threads_current_threads # TYPE tomcat_threads_current_threads gauge tomcat_threads_current_threads{name="http-nio-10086",} 50.0 # HELP jvm_memory_max_bytes The maximum amount of memory in bytes that can be used for memory management # TYPE jvm_memory_max_bytes gauge jvm_memory_max_bytes{area="heap",id="PS Survivor Space",} 1.6252928E7 jvm_memory_max_bytes{area="heap",id="PS Old Gen",} 2.751463424E9 jvm_memory_max_bytes{area="heap",id="PS Eden Space",} 1.336410112E9 jvm_memory_max_bytes{area="nonheap",id="Metaspace",} -1.0 jvm_memory_max_bytes{area="nonheap",id="Code Cache",} 2.5165824E8 jvm_memory_max_bytes{area="nonheap",id="Compressed Class Space",} 1.073741824E9 # HELP tomcat_servlet_error_total # TYPE tomcat_servlet_error_total counter tomcat_servlet_error_total{name="dispatcherServlet",} 0.0 # HELP jvm_threads_daemon_threads The current number of live daemon threads # TYPE jvm_threads_daemon_threads gauge jvm_threads_daemon_threads 107.0 # HELP jvm_memory_used_bytes The amount of used memory # TYPE jvm_memory_used_bytes gauge jvm_memory_used_bytes{area="heap",id="PS Survivor Space",} 1.6238736E7 jvm_memory_used_bytes{area="heap",id="PS Old Gen",} 2.7538488E7 jvm_memory_used_bytes{area="heap",id="PS Eden Space",} 2.36629096E8 jvm_memory_used_bytes{area="nonheap",id="Metaspace",} 5.5265272E7 jvm_memory_used_bytes{area="nonheap",id="Code Cache",} 1.5770176E7 jvm_memory_used_bytes{area="nonheap",id="Compressed Class Space",} 7257680.0 # HELP tomcat_thread_pool_info tomcat_thread_pool_info # TYPE tomcat_thread_pool_info gauge # HELP tomcat_global_request_max_seconds # TYPE tomcat_global_request_max_seconds gauge tomcat_global_request_max_seconds{name="http-nio-10086",} 1.325 # HELP process_uptime_seconds The uptime of the Java virtual machine # TYPE process_uptime_seconds gauge process_uptime_seconds 414.56 # HELP system_cpu_usage The "recent cpu usage" for the whole system # TYPE system_cpu_usage gauge system_cpu_usage 0.15617296080373955 # HELP tomcat_sessions_expired_sessions_total # TYPE tomcat_sessions_expired_sessions_total counter tomcat_sessions_expired_sessions_total 0.0 # HELP tomcat_servlet_request_max_seconds # TYPE tomcat_servlet_request_max_seconds gauge tomcat_servlet_request_max_seconds{name="dispatcherServlet",} 1.292 # HELP jvm_buffer_count_buffers An estimate of the number of buffers in the pool # TYPE jvm_buffer_count_buffers gauge jvm_buffer_count_buffers{id="direct",} 53.0 jvm_buffer_count_buffers{id="mapped",} 0.0 # HELP jvm_threads_states_threads The current number of threads having NEW state # TYPE jvm_threads_states_threads gauge jvm_threads_states_threads{state="runnable",} 21.0 jvm_threads_states_threads{state="blocked",} 0.0 jvm_threads_states_threads{state="waiting",} 49.0 jvm_threads_states_threads{state="timed-waiting",} 54.0 jvm_threads_states_threads{state="new",} 0.0 jvm_threads_states_threads{state="terminated",} 0.0 # HELP tomcat_cache_access_total # TYPE tomcat_cache_access_total counter tomcat_cache_access_total 0.0 # HELP jvm_buffer_total_capacity_bytes An estimate of the total capacity of the buffers in this pool # TYPE jvm_buffer_total_capacity_bytes gauge jvm_buffer_total_capacity_bytes{id="direct",} 421904.0 jvm_buffer_total_capacity_bytes{id="mapped",} 0.0 # HELP jvm_gc_live_data_size_bytes Size of old generation memory pool after a full GC # TYPE jvm_gc_live_data_size_bytes gauge jvm_gc_live_data_size_bytes 1.49782E7 # HELP jvm_memory_committed_bytes The amount of memory in bytes that is committed for the Java virtual machine to use # TYPE jvm_memory_committed_bytes gauge jvm_memory_committed_bytes{area="heap",id="PS Survivor Space",} 1.6252928E7 jvm_memory_committed_bytes{area="heap",id="PS Old Gen",} 1.27401984E8 jvm_memory_committed_bytes{area="heap",id="PS Eden Space",} 2.69484032E8 jvm_memory_committed_bytes{area="nonheap",id="Metaspace",} 6.0342272E7 jvm_memory_committed_bytes{area="nonheap",id="Code Cache",} 1.5794176E7 jvm_memory_committed_bytes{area="nonheap",id="Compressed Class Space",} 8175616.0 # HELP tomcat_threads_busy_threads # TYPE tomcat_threads_busy_threads gauge tomcat_threads_busy_threads{name="http-nio-10086",} 1.0 # HELP tomcat_cache_hit_total # TYPE tomcat_cache_hit_total counter tomcat_cache_hit_total 0.0 # HELP jvm_gc_memory_allocated_bytes_total Incremented for an increase in the size of the young generation memory pool after one GC to before the next # TYPE jvm_gc_memory_allocated_bytes_total counter jvm_gc_memory_allocated_bytes_total 5.43316024E8 # HELP jvm_classes_unloaded_classes_total The total number of classes unloaded since the Java virtual machine has started execution # TYPE jvm_classes_unloaded_classes_total counter jvm_classes_unloaded_classes_total 2.0 # HELP hikaricp_connections_usage_seconds Connection usage time # TYPE hikaricp_connections_usage_seconds summary hikaricp_connections_usage_seconds_count{pool="grafana-hikari-pool",} 2002.0 hikaricp_connections_usage_seconds_sum{pool="grafana-hikari-pool",} 40.873 # HELP hikaricp_connections_usage_seconds_max Connection usage time # TYPE hikaricp_connections_usage_seconds_max gauge hikaricp_connections_usage_seconds_max{pool="grafana-hikari-pool",} 0.306 # HELP http_server_requests_seconds # TYPE http_server_requests_seconds summary http_server_requests_seconds_count{exception="None",method="GET",outcome="SUCCESS",status="200",uri="/actuator/prometheus",} 28.0 http_server_requests_seconds_sum{exception="None",method="GET",outcome="SUCCESS",status="200",uri="/actuator/prometheus",} 4.8066835 http_server_requests_seconds_count{exception="None",method="GET",outcome="SUCCESS",status="200",uri="/user/test",} 2000.0 http_server_requests_seconds_sum{exception="None",method="GET",outcome="SUCCESS",status="200",uri="/user/test",} 74.450206 # HELP http_server_requests_seconds_max # TYPE http_server_requests_seconds_max gauge http_server_requests_seconds_max{exception="None",method="GET",outcome="SUCCESS",status="200",uri="/actuator/prometheus",} 0.1568263 http_server_requests_seconds_max{exception="None",method="GET",outcome="SUCCESS",status="200",uri="/user/test",} 0.5168904 # HELP tomcat_sessions_created_sessions_total # TYPE tomcat_sessions_created_sessions_total counter tomcat_sessions_created_sessions_total 0.0 # HELP hikaricp_connections_acquire_seconds Connection acquire time # TYPE hikaricp_connections_acquire_seconds summary hikaricp_connections_acquire_seconds_count{pool="grafana-hikari-pool",} 2002.0 hikaricp_connections_acquire_seconds_sum{pool="grafana-hikari-pool",} 9.510603 # HELP hikaricp_connections_acquire_seconds_max Connection acquire time # TYPE hikaricp_connections_acquire_seconds_max gauge hikaricp_connections_acquire_seconds_max{pool="grafana-hikari-pool",} 0.3078482 # HELP jvm_buffer_memory_used_bytes An estimate of the memory that the Java virtual machine is using for this buffer pool # TYPE jvm_buffer_memory_used_bytes gauge jvm_buffer_memory_used_bytes{id="direct",} 421904.0 jvm_buffer_memory_used_bytes{id="mapped",} 0.0 # HELP jvm_gc_memory_promoted_bytes_total Count of positive increases in the size of the old generation memory pool before GC to after GC # TYPE jvm_gc_memory_promoted_bytes_total counter jvm_gc_memory_promoted_bytes_total 1.8795408E7 # HELP tomcat_global_received_bytes_total # TYPE tomcat_global_received_bytes_total counter tomcat_global_received_bytes_total{name="http-nio-10086",} 0.0 # HELP hikaricp_connections Total connections # TYPE hikaricp_connections gauge hikaricp_connections{pool="grafana-hikari-pool",} 47.0 # HELP hikaricp_connections_creation_seconds_max Connection creation time # TYPE hikaricp_connections_creation_seconds_max gauge hikaricp_connections_creation_seconds_max{pool="grafana-hikari-pool",} 0.038 # HELP hikaricp_connections_creation_seconds Connection creation time # TYPE hikaricp_connections_creation_seconds summary hikaricp_connections_creation_seconds_count{pool="grafana-hikari-pool",} 46.0 hikaricp_connections_creation_seconds_sum{pool="grafana-hikari-pool",} 0.479 # HELP hikaricp_connections_active Active connections # TYPE hikaricp_connections_active gauge hikaricp_connections_active{pool="grafana-hikari-pool",} 0.0 # HELP jdbc_connections_max Maximum number of active connections that can be allocated at the same time. # TYPE jdbc_connections_max gauge jdbc_connections_max{name="dataSource",} 50.0 # HELP process_start_time_seconds Start time of the process since unix epoch. # TYPE process_start_time_seconds gauge process_start_time_seconds 1.693547474058E9 # HELP jvm_threads_peak_threads The peak live thread count since the Java virtual machine started or peak was reset # TYPE jvm_threads_peak_threads gauge jvm_threads_peak_threads 125.0 # HELP logback_events_total Number of error level events that made it to the logs # TYPE logback_events_total counter logback_events_total{level="warn",} 5.0 logback_events_total{level="debug",} 0.0 logback_events_total{level="error",} 0.0 logback_events_total{level="trace",} 0.0 logback_events_total{level="info",} 16.0- 1
- 2
- 3
- 4
- 5
- 6
- 7
- 8
- 9
- 10
- 11
- 12
- 13
- 14
- 15
- 16
- 17
- 18
- 19
- 20
- 21
- 22
- 23
- 24
- 25
- 26
- 27
- 28
- 29
- 30
- 31
- 32
- 33
- 34
- 35
- 36
- 37
- 38
- 39
- 40
- 41
- 42
- 43
- 44
- 45
- 46
- 47
- 48
- 49
- 50
- 51
- 52
- 53
- 54
- 55
- 56
- 57
- 58
- 59
- 60
- 61
- 62
- 63
- 64
- 65
- 66
- 67
- 68
- 69
- 70
- 71
- 72
- 73
- 74
- 75
- 76
- 77
- 78
- 79
- 80
- 81
- 82
- 83
- 84
- 85
- 86
- 87
- 88
- 89
- 90
- 91
- 92
- 93
- 94
- 95
- 96
- 97
- 98
- 99
- 100
- 101
- 102
- 103
- 104
- 105
- 106
- 107
- 108
- 109
- 110
- 111
- 112
- 113
- 114
- 115
- 116
- 117
- 118
- 119
- 120
- 121
- 122
- 123
- 124
- 125
- 126
- 127
- 128
- 129
- 130
- 131
- 132
- 133
- 134
- 135
- 136
- 137
- 138
- 139
- 140
- 141
- 142
- 143
- 144
- 145
- 146
- 147
- 148
- 149
- 150
- 151
- 152
- 153
- 154
- 155
- 156
- 157
- 158
- 159
- 160
- 161
- 162
- 163
- 164
- 165
- 166
- 167
- 168
- 169
- 170
- 171
- 172
- 173
- 174
- 175
- 176
- 177
- 178
- 179
- 180
- 181
- 182
- 183
- 184
- 185
- 186
- 187
- 188
- 189
- 190
- 191
- 192
- 193
- 194
- 195
- 196
- 197
- 198
- 199
- 200
- 201
- 202
- 203
- 204
- 205
- 206
- 207
- 208
- 209
- 210
- 211
- 212
- 213
- 214
- 215
- 216
- 217
- 218
- 219
- 220
- 221
- 222
- 223
- 224
- 225
prometheus的管理页面
http://localhost:9090/

grafana创建监控看板


数据源创建好之后就可以创建监控看板了dashboard

这是自己创建好的一个例子


- 根据自己的场景选择合适的监控图标,能更好的展示我们监控的指标
后台SpringBoot服务添加自定义监控数据,上送给prometheus
依赖
<dependency> <groupId>org.springframework.bootgroupId> <artifactId>spring-boot-starter-actuatorartifactId> dependency> <dependency> <groupId>io.micrometergroupId> <artifactId>micrometer-registry-prometheusartifactId> dependency> <dependency> <groupId>io.prometheusgroupId> <artifactId>simpleclient_pushgatewayartifactId> dependency>- 1
- 2
- 3
- 4
- 5
- 6
- 7
- 8
- 9
- 10
- 11
- 12
- 13
- 14
- 15
- 16
- 17
注册监控点
package com.kang.grafana.monitor; import com.alibaba.fastjson.JSON; import com.alibaba.fastjson.JSONArray; import com.alibaba.fastjson.JSONObject; import com.alibaba.fastjson.serializer.SerializerFeature; import io.micrometer.prometheus.PrometheusMeterRegistry; import io.prometheus.client.CollectorRegistry; import io.prometheus.client.Gauge; import lombok.extern.slf4j.Slf4j; import org.springframework.beans.factory.annotation.Autowired; import org.springframework.boot.web.embedded.tomcat.TomcatWebServer; import org.springframework.boot.web.servlet.context.ServletWebServerApplicationContext; import org.springframework.context.annotation.Bean; import org.springframework.context.annotation.Configuration; import javax.annotation.PostConstruct; import javax.annotation.PreDestroy; import java.util.concurrent.Executor; /** * @Author Emperor Kang * @ClassName PrometheusMetricMonitor * @Description prometheus监控类 * @Date 2023/8/31 15:51 * @Version 1.0 * @Motto 让营地比你来时更干净 */ @Slf4j @Configuration public class PrometheusMetricMonitor { @Autowired ServletWebServerApplicationContext applicationContext; @Autowired private PrometheusMeterRegistry prometheusMeterRegistry; @Bean public Gauge gauge(){ Gauge gauge = Gauge.build() .name("tomcat_thread_pool_info") .labelNames("attributeDescription") .help("tomcat_thread_pool_info") .register(); CollectorRegistry prometheusRegistry = prometheusMeterRegistry.getPrometheusRegistry(); prometheusRegistry.register(gauge); return gauge; } @PostConstruct public void initialize(){ log.info("开始执行initialize方法"); log.info("initialize执行成功"); } @PreDestroy public void preDestroy(){ log.info("开始执行preDestroy方法"); } }- 1
- 2
- 3
- 4
- 5
- 6
- 7
- 8
- 9
- 10
- 11
- 12
- 13
- 14
- 15
- 16
- 17
- 18
- 19
- 20
- 21
- 22
- 23
- 24
- 25
- 26
- 27
- 28
- 29
- 30
- 31
- 32
- 33
- 34
- 35
- 36
- 37
- 38
- 39
- 40
- 41
- 42
- 43
- 44
- 45
- 46
- 47
- 48
- 49
- 50
- 51
- 52
- 53
- 54
- 55
- 56
- 57
- 58
- 59
- 60
- 61
- 62
每次调用去上送自己的实时数据
package com.kang.grafana.monitor; import com.alibaba.fastjson.JSON; import com.alibaba.fastjson.JSONArray; import com.alibaba.fastjson.JSONObject; import com.alibaba.fastjson.serializer.SerializerFeature; import io.prometheus.client.Gauge; import org.springframework.beans.factory.annotation.Autowired; import org.springframework.boot.web.embedded.tomcat.TomcatWebServer; import org.springframework.boot.web.servlet.context.ServletWebServerApplicationContext; import org.springframework.stereotype.Component; import java.util.concurrent.Executor; /** * @Author Emperor Kang * @ClassName PrometheusUtil * @Description TODO * @Date 2023/9/4 18:43 * @Version 1.0 * @Motto 让营地比你来时更干净 */ @Component public class PrometheusUtil { @Autowired ServletWebServerApplicationContext applicationContext; @Autowired private Gauge gauge; /** * 上送数据 */ public void pullGateWay() { Executor executor = ((TomcatWebServer) applicationContext.getWebServer()).getTomcat().getConnector().getProtocolHandler().getExecutor(); // 获取内置tomcat的线程池情况 String executorInfo = JSON.toJSONString(executor, SerializerFeature.WriteMapNullValue); JSONObject tomcatThreadPoolInfo = JSON.parseObject(executorInfo); gauge.labels("activeCount").set(tomcatThreadPoolInfo.getLong("activeCount")); gauge.labels("largestPoolSize").set(tomcatThreadPoolInfo.getLong("largestPoolSize")); gauge.labels("poolSize").set(tomcatThreadPoolInfo.getLong("poolSize")); gauge.labels("taskCount").set(tomcatThreadPoolInfo.getLong("taskCount")); gauge.labels("corePoolSize").set(tomcatThreadPoolInfo.getLong("corePoolSize")); gauge.labels("submittedCount").set(tomcatThreadPoolInfo.getLong("submittedCount")); gauge.labels("completedTaskCount").set(tomcatThreadPoolInfo.getLong("completedTaskCount")); gauge.labels("maximumPoolSize").set(tomcatThreadPoolInfo.getLong("maximumPoolSize")); gauge.labels("queue").set(tomcatThreadPoolInfo.getObject("queue", JSONArray.class).size()); gauge.labels("threadRenewalDelay").set(tomcatThreadPoolInfo.getLong("threadRenewalDelay")); } }- 1
- 2
- 3
- 4
- 5
- 6
- 7
- 8
- 9
- 10
- 11
- 12
- 13
- 14
- 15
- 16
- 17
- 18
- 19
- 20
- 21
- 22
- 23
- 24
- 25
- 26
- 27
- 28
- 29
- 30
- 31
- 32
- 33
- 34
- 35
- 36
- 37
- 38
- 39
- 40
- 41
- 42
- 43
- 44
- 45
- 46
- 47
- 48
- 49
- 50
- 51
package com.kang.grafana.controller; import com.alibaba.fastjson.JSON; import com.alibaba.fastjson.JSONArray; import com.alibaba.fastjson.JSONObject; import com.alibaba.fastjson.serializer.SerializerFeature; import com.kang.grafana.monitor.PrometheusUtil; import com.kang.grafana.service.IUserService; import io.prometheus.client.Gauge; import org.springframework.beans.factory.annotation.Autowired; import org.springframework.boot.web.embedded.tomcat.TomcatWebServer; import org.springframework.boot.web.servlet.context.ServletWebServerApplicationContext; import org.springframework.web.bind.annotation.RequestMapping; import org.springframework.web.bind.annotation.RestController; import java.util.concurrent.Executor; /** ** 用户表 前端控制器 *
* * @author zkk * @since 2023-01-04 */ @RestController @RequestMapping("/user") public class UserController { @Autowired ServletWebServerApplicationContext applicationContext; @Autowired private IUserService userService; @Autowired private PrometheusUtil prometheusUtil; @RequestMapping("/test") public Object get() throws InterruptedException { prometheusUtil.pullGateWay(); Thread.sleep(1500); return userService.getById(10); } }- 1
- 2
- 3
- 4
- 5
- 6
- 7
- 8
- 9
- 10
- 11
- 12
- 13
- 14
- 15
- 16
- 17
- 18
- 19
- 20
- 21
- 22
- 23
- 24
- 25
- 26
- 27
- 28
- 29
- 30
- 31
- 32
- 33
- 34
- 35
- 36
- 37
- 38
- 39
- 40
- 41
- 42
- 43
- 44
- 45
- 46
利用jmeter进行访问


看板看到的结果就是

备注
这里只是初步了解学习,中间估计还有很多为了解到的东西,本次仅限了解使用,待打磨
-
相关阅读:
【均值漂移】mean-shift算法详解
c++中一种数据封装的技巧
QT5.12.1+OpenCV(含Contrib)环境搭建
JavaScript —— 算法思想之递归和映射
BUUCTF Reverse/crackMe
URDF+Gazebo+Rviz仿真
华为OD机试 - 最大括号深度 - 栈stack(Java 2023 B卷 100分)
APP自动化之weditor工具
「Python」身份运算符 —— is 与 is not
插件_日期_lunar-calendar公历农历转换
- 原文地址:https://blog.csdn.net/LuckFairyLuckBaby/article/details/132838710