-
Prometheus-PushGateway自定义监控项
一、前言
pushgateway相比较exporter是主动向服务器发送请求,pushgateway本身也是一个程序,可以运行在任意节点上(不是必须在被监控端),运行本身没有抓取数据的功能,它只是被动的等待推送过来,然后发现服务端。
二、PushGateway安装
1、GitHub下载解压
PushGateway下载地址:
wget https://github.com/prometheus/pushgateway/releases/download/v1.5.0/pushgateway-1.5.0.linux-amd64.tar.gz- 1
2、运行pushgateway 默认端口是
9091,可以使用--web.listen-address更改默认端口tar zxf pushgateway-1.5.0.linux-amd64.tar.gz mv pushgateway-1.5.0.linux-amd64 /usr/local/pushgateway cd /usr/local/pushgateway ./pushgateway --web.listen-address=:19091- 1
- 2
- 3
- 4
PS:前台启动没有报错就可以 ^C 停止掉了,我们配置systemd管理!
3、配置system管理
cat > /usr/lib/systemd/system/pushgateway.service << EOF [Unit] Description=prometheus pushgateway After=network.target [Service] Type=simple User=root Group=root ExecStart=/usr/local/pushgateway/pushgateway --web.listen-address=:19091 ExecStop=/usr/bin/kill -HUP \$MAINPID [Install] WantedBy=multi-user.target EOF- 1
- 2
- 3
- 4
- 5
- 6
- 7
- 8
- 9
- 10
- 11
- 12
- 13
- 14
- 15
启动并加入开机自启动
systemctl enable pushgateway.service --now systemctl status pushgateway.service- 1
- 2

如上图,查看状态是
active (running)表示已经起来了!4、Prometheus配置文件中,添加PushGateway地址
- job_name: "prometheus gateway" static_configs: - targets: ["localhost:19091"]- 1
- 2
- 3
systemctl restart prometheus.service systemctl status prometheus.service- 1
- 2
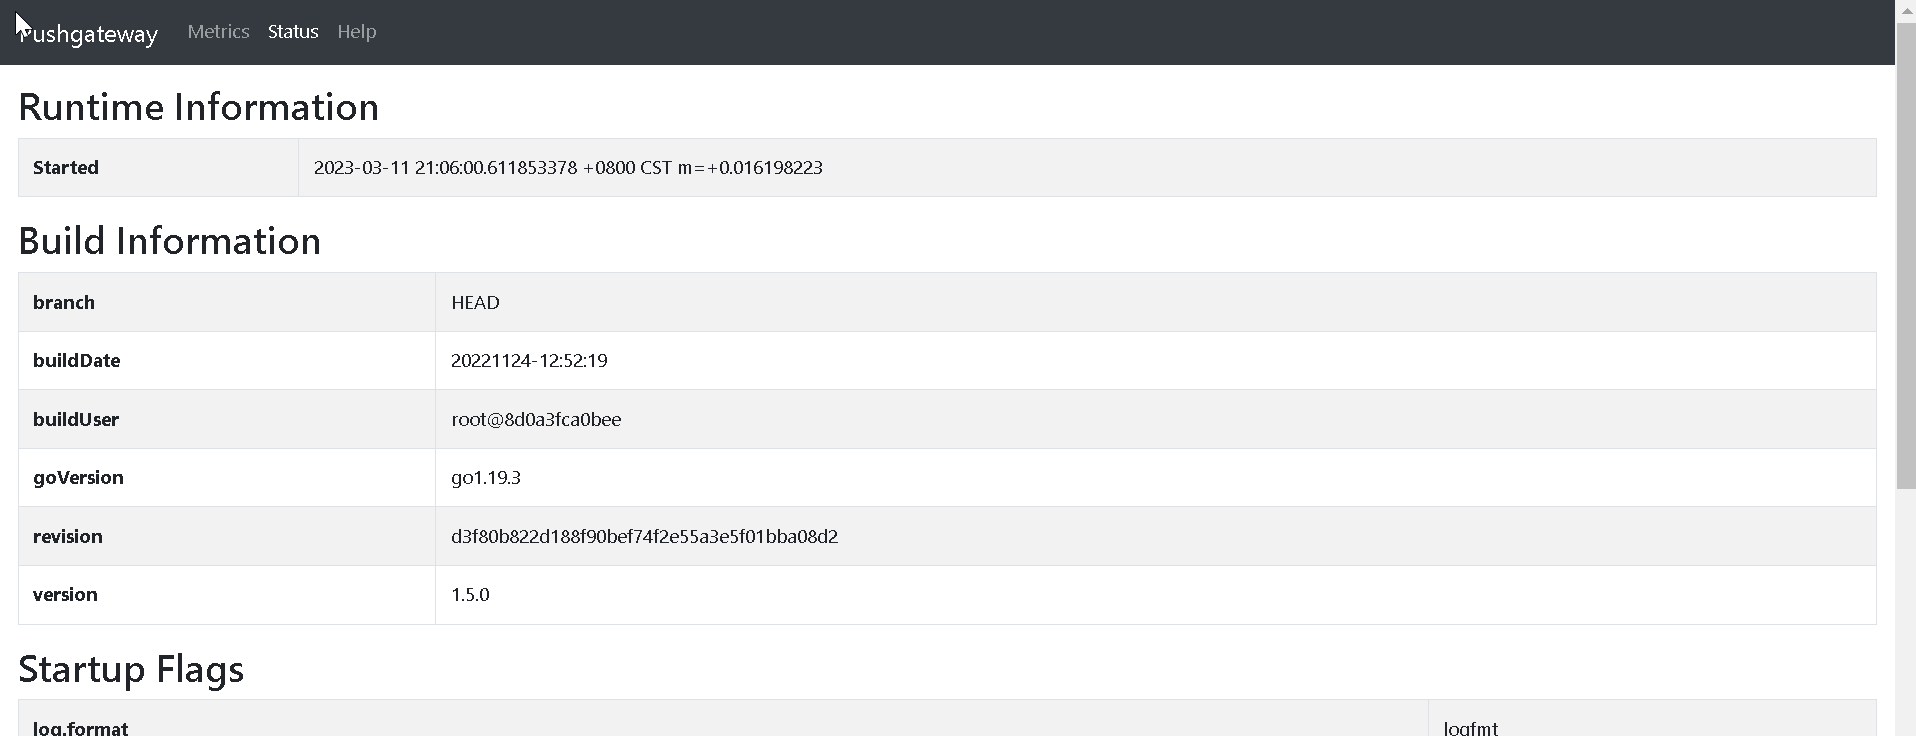
5、验证
浏览器访问IP:19091验证pushgateway页面
验证Prometheus页面

三、PushGateway的使用
1、推送单个样本
echo "test_metric 1314521" | curl --data-binary @- http://localhost:19091/metrics/job/test_job- 1
pushgateway页面可以看到推送的数据 如下图所示:

- test_metric 1314521: 推送的键 值
- job/test_job:标签
job=test_job,多个标签直接往后添加即可 - data-binary:发送post请求 以二进制数据
四、PushGateway脚本思路
使用shell脚本推送
netstat wait数量#!/bin/bash pushgateway="localhost:19091" lable="count_netstat_wait_connections" count_netstat_wait_connections=$(netstat -an|grep -i wait|wc -l) if [ ${HOSTNAME} == "localhost" ];then echo "主机名不可使用 'localhost'" && exit 5 fi # 这里定义了两个标签 job=pushgateway-1 hostname=${HOSTNAME} echo "${lable} $count_netstat_wait_connections"|curl --data-binary @- http://${pushgateway}/metrics/job/pushgateway-1/hostname/${HOSTNAME}- 1
- 2
- 3
- 4
- 5
- 6
- 7
- 8
- 9
- 10
- 11
执行脚本 检查是否能推送到pushgateway页面

使用定时任务执执行脚本,每3秒推送一次数据
crontab -e * * * * * /usr/bin/sleep 3; /bin/bash /root/qinzt/pushgateway.sh- 1
- 2
prometheus中查询数据

-
相关阅读:
说说HBase Region核心切分流程?
力扣题解 Java语言实现 -- LRU 缓存
婴儿提篮亚马逊美国CPC认证ASTM F2194具体要求介绍
华为云项目部署
数据库内核面试中我不会的问题(5)
zabbix-agent主动模式下自定义监控项和监控指标
计算机网络 | 网络安全 | HTTP & HTTPS | URI解析全过程
搭建第一个区块链网络
Apollo第二讲—apollo自动驾驶调试及仿真实践
残差网络为什么有效
- 原文地址:https://blog.csdn.net/weixin_45310323/article/details/132816284