-
Echarts图表跟随父容器的变化自适应
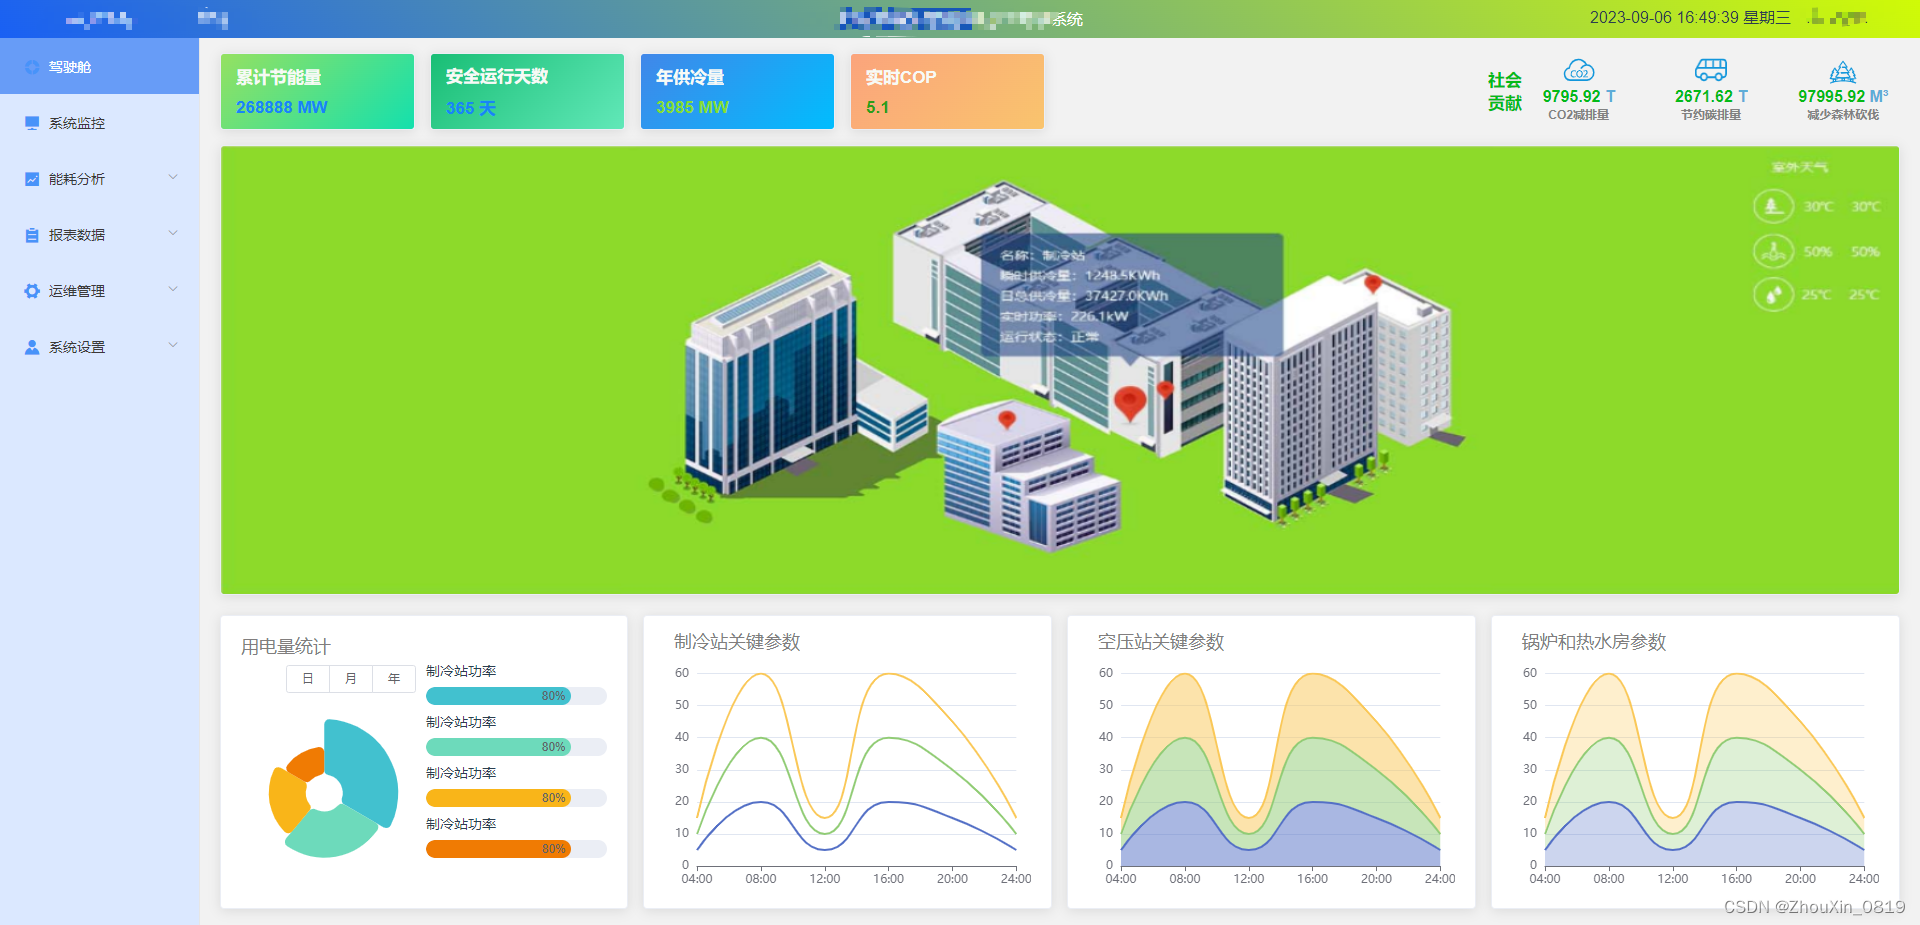
如果页面中有多个图表 隐藏/展开左边侧边栏echarts图表自适应
<div class="line"> <div class="title">制冷站关键参数</div> <div id="chartLine1" style="width: 100%;height:85%;"></div> </div> <div class="line"> <div class="title">空压站关键参数</div> <div id="chartLine2" style="width: 100%;height:85%;"></div> </div> <div class="line"> <div class="title">锅炉和热水房参数</div> <div id="chartLine3" style="width: 100%;height:85%;"></div> </div> data() { myChart1: '', myChart2: '', myChart3: '', }, //核心代码 new ResizeObserver mounted() { this.$nextTick(() => { this.chart1(); this.chart2(); this.chart3(); const resizeOb = new ResizeObserver((entries) => { for (const entry of entries) { this.$echarts.getInstanceByDom(entry.target).resize(); } }); // 使用observe开启监听, onObserve可以取消监听 resizeOb.observe(document.getElementById('chartLine1')); resizeOb.observe(document.getElementById('chartLine2')); resizeOb.observe(document.getElementById('chartLine3')); }); }, methods: { chart1() { // 基于准备好的dom,初始化echarts实例 this.myChart1 = this.$echarts.init(document.getElementById('chartLine1')); // 指定图表的配置项和数据 const option = { tooltip: { trigger: 'axis' }, grid: { top: '5%', left: '3%', right: '4%', bottom: '3%', containLabel: true }, xAxis: { type: 'category', boundaryGap: false, data: ['04:00', '08:00', '12:00', '16:00', '20:00', '24:00'] }, yAxis: { type: 'value' }, series: [ { name: '实时cop', type: 'line', stack: 'Total', smooth: true, symbol: "none", data: [5, 20, 5, 20, 15, 5] }, { name: '月度cop', type: 'line', stack: 'Total', smooth: true, symbol: "none", data: [5, 20, 5, 20, 15, 5] }, { name: '年度cop', type: 'line', stack: 'Total', smooth: true, symbol: "none", data: [5, 20, 5, 20, 15, 5] } ] }; // 使用刚指定的配置项和数据显示图表。 this.myChart1.setOption(option); }, //...chart2 ...chart3 }- 1
- 2
- 3
- 4
- 5
- 6
- 7
- 8
- 9
- 10
- 11
- 12
- 13
- 14
- 15
- 16
- 17
- 18
- 19
- 20
- 21
- 22
- 23
- 24
- 25
- 26
- 27
- 28
- 29
- 30
- 31
- 32
- 33
- 34
- 35
- 36
- 37
- 38
- 39
- 40
- 41
- 42
- 43
- 44
- 45
- 46
- 47
- 48
- 49
- 50
- 51
- 52
- 53
- 54
- 55
- 56
- 57
- 58
- 59
- 60
- 61
- 62
- 63
- 64
- 65
- 66
- 67
- 68
- 69
- 70
- 71
- 72
- 73
- 74
- 75
- 76
- 77
- 78
- 79
- 80
- 81
- 82
- 83
- 84
- 85
- 86
- 87
- 88
- 89
- 90
- 91

-
相关阅读:
【微机接口】第9章:微型计算机系统串行通信
C++存储类
深度学习案例分享 | PyTorch 实现 Fashion-MNIST 服装数据分类
房产网源码 房产中介小程序源码 房产门户网站源码
用于清理数据的五个简单有效 Python 脚本
uniapp插件自定义
几款常见存储系统的对比分析
你与年薪百万的项目经理,可能就差一个字母
2020年下半年试题一:论信息系统项目的成本管理
sqlmap结合dnslog快速注入
- 原文地址:https://blog.csdn.net/weixin_50466102/article/details/132718656