composer require phpoffice/ phpspreadsheet
use PhpOffice\ PhpSpreadsheet\ Chart\ Chart ;
use PhpOffice\ PhpSpreadsheet\ Chart\ DataSeries ;
use PhpOffice\ PhpSpreadsheet\ Chart\ DataSeriesValues ;
use PhpOffice\ PhpSpreadsheet\ Chart\ Layout ;
use PhpOffice\ PhpSpreadsheet\ Chart\ Legend as ChartLegend;
use PhpOffice\ PhpSpreadsheet\ Chart\ PlotArea ;
use PhpOffice\ PhpSpreadsheet\ Chart\ Properties ;
use PhpOffice\ PhpSpreadsheet\ Chart\ Title ;
use PhpOffice\ PhpSpreadsheet\ IOFactory ;
use PhpOffice\ PhpSpreadsheet\ Spreadsheet ;
$spreadsheet = new Spreadsheet ( ) ;
$worksheet = $spreadsheet -> getActiveSheet ( ) ;
$worksheet -> fromArray (
[
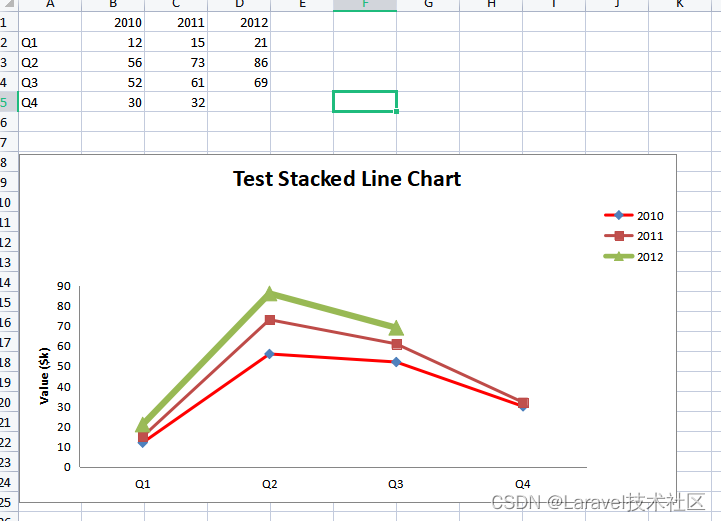
[ '' , 2010 , 2011 , 2012 ] ,
[ 'Q1' , 12 , 15 , 21 ] ,
[ 'Q2' , 56 , 73 , 86 ] ,
[ 'Q3' , 52 , 61 , 69 ] ,
[ 'Q4' , 30 , 32 , 0 ] ,
]
) ;
$dataSeriesLabels = [
new DataSeriesValues ( DataSeriesValues :: DATASERIES_TYPE_STRING , 'Worksheet!$B$1' , null , 1 ) ,
new DataSeriesValues ( DataSeriesValues :: DATASERIES_TYPE_STRING , 'Worksheet!$C$1' , null , 1 ) ,
new DataSeriesValues ( DataSeriesValues :: DATASERIES_TYPE_STRING , 'Worksheet!$D$1' , null , 1 ) ,
] ;
$dataSeriesLabels [ 0 ] -> setFillColor ( 'FF0000' ) ;
$xAxisTickValues = [
new DataSeriesValues ( DataSeriesValues :: DATASERIES_TYPE_STRING , 'Worksheet!$A$2:$A$5' , null , 4 ) ,
] ;
$dataSeriesValues = [
new DataSeriesValues ( DataSeriesValues :: DATASERIES_TYPE_NUMBER , 'Worksheet!$B$2:$B$5' , null , 4 ) ,
new DataSeriesValues ( DataSeriesValues :: DATASERIES_TYPE_NUMBER , 'Worksheet!$C$2:$C$5' , null , 4 ) ,
new DataSeriesValues ( DataSeriesValues :: DATASERIES_TYPE_NUMBER , 'Worksheet!$D$2:$D$5' , null , 4 ) ,
] ;
$dataSeriesValues [ 2 ] -> setLineWidth ( 60000 / Properties :: POINTS_WIDTH_MULTIPLIER ) ;
$series = new DataSeries (
DataSeries :: TYPE_LINECHART ,
DataSeries :: GROUPING_STANDARD ,
range ( 0 , count ( $dataSeriesValues ) - 1 ) ,
$dataSeriesLabels ,
$xAxisTickValues ,
$dataSeriesValues ,
null ,
true
) ;
$series -> setPlotDirection ( DataSeries :: DIRECTION_COL ) ;
$plotArea = new PlotArea ( null , [ $series ] ) ;
$legend = new ChartLegend ( ChartLegend :: POSITION_TOPRIGHT , null , false ) ;
$title = new Title ( 'Test Stacked Line Chart' ) ;
$yAxisLabel = new Title ( 'Value ($k)' ) ;
$chart = new Chart (
'chart1' ,
$title ,
$legend ,
$plotArea ,
true ,
DataSeries :: EMPTY_AS_GAP ,
null ,
$yAxisLabel
) ;
$chart -> setTopLeftPosition ( 'A7' ) ;
$chart -> setBottomRightPosition ( 'o30' ) ;
$worksheet -> addChart ( $chart ) ;
$filename = "test" ;
header ( 'Content-Type: application/vnd.openxmlformats-officedocument.spreadsheetml.sheet;charset=UTF-8' ) ;
header ( 'Content-Disposition: attachment;filename="' . $filename . '.xlsx"' ) ;
header ( 'Cache-Control: max-age=0' ) ;
ob_end_clean ( ) ;
$writer = IOFactory :: createWriter ( $spreadsheet , 'Xlsx' ) ;
$writer -> setIncludeCharts ( true ) ;
$writer -> save ( "php://output" ) ;
$spreadsheet -> disconnectWorksheets ( ) ;
1 2 3 4 5 6 7 8 9 10 11 12 13 14 15 16 17 18 19 20 21 22 23 24 25 26 27 28 29 30 31 32 33 34 35 36 37 38 39 40 41 42 43 44 45 46 47 48 49 50 51 52 53 54 55 56 57 58 59 60 61 62 63 64 65 66 67 68 69 70 71 72 73 74 75 76 77 78 79 80 81 82 83 84 use PhpOffice\ PhpSpreadsheet\ Chart\ Chart ;
use PhpOffice\ PhpSpreadsheet\ Chart\ DataSeries ;
use PhpOffice\ PhpSpreadsheet\ Chart\ DataSeriesValues ;
use PhpOffice\ PhpSpreadsheet\ Chart\ Layout ;
use PhpOffice\ PhpSpreadsheet\ Chart\ PlotArea ;
use PhpOffice\ PhpSpreadsheet\ Chart\ Title ;
use PhpOffice\ PhpSpreadsheet\ IOFactory ;
use PhpOffice\ PhpSpreadsheet\ Spreadsheet ;
use PhpOffice\ PhpSpreadsheet\ Chart\ Legend as ChartLegend;
$spreadsheet = new Spreadsheet ( ) ;
$worksheet = $spreadsheet -> getActiveSheet ( ) ;
$worksheet -> fromArray (
[
[ '' , 2010 , 2011 , 2012 ] ,
[ 'Q1' , 12 , 15 , 21 ] ,
[ 'Q2' , 56 , 73 , 86 ] ,
[ 'Q3' , 52 , 61 , 69 ] ,
[ 'Q4' , 30 , 32 , 0 ] ,
]
) ;
$dataSeriesLabels1 = [
new DataSeriesValues ( DataSeriesValues :: DATASERIES_TYPE_STRING , 'Worksheet!$C$1' , null , 1 ) ,
] ;
$xAxisTickValues1 = [
new DataSeriesValues ( DataSeriesValues :: DATASERIES_TYPE_STRING , 'Worksheet!$A$2:$A$5' , null , 4 ) ,
] ;
$dataSeriesValues1 = [
new DataSeriesValues ( DataSeriesValues :: DATASERIES_TYPE_NUMBER , 'Worksheet!$C$2:$C$5' , null , 4 ) ,
] ;
$series1 = new DataSeries (
DataSeries :: TYPE_PIECHART ,
null ,
range ( 0 , count ( $dataSeriesValues1 ) - 1 ) ,
$dataSeriesLabels1 ,
$xAxisTickValues1 ,
$dataSeriesValues1
) ;
$layout1 = new Layout ( ) ;
$layout1 -> setShowVal ( true ) ;
$layout1 -> setShowPercent ( true ) ;
$plotArea1 = new PlotArea ( $layout1 , [ $series1 ] ) ;
$legend1 = new ChartLegend ( ChartLegend :: POSITION_RIGHT , null , false ) ;
$title1 = new Title ( 'Test Pie Chart' ) ;
$chart1 = new Chart (
'chart1' ,
$title1 ,
$legend1 ,
$plotArea1 ,
true ,
DataSeries :: EMPTY_AS_GAP ,
null ,
null
) ;
$chart1 -> setTopLeftPosition ( 'A7' ) ;
$chart1 -> setBottomRightPosition ( 'H20' ) ;
$worksheet -> addChart ( $chart1 ) ;
$dataSeriesLabels2 = [
new DataSeriesValues ( DataSeriesValues :: DATASERIES_TYPE_STRING , 'Worksheet!$C$1' , null , 1 ) ,
] ;
$xAxisTickValues2 = [
new DataSeriesValues ( DataSeriesValues :: DATASERIES_TYPE_STRING , 'Worksheet!$A$2:$A$5' , null , 4 ) ,
] ;
$dataSeriesValues2 = [
new DataSeriesValues ( DataSeriesValues :: DATASERIES_TYPE_NUMBER , 'Worksheet!$C$2:$C$5' , null , 4 ) ,
] ;
$series2 = new DataSeries (
DataSeries :: TYPE_DONUTCHART ,
null ,
range ( 0 , count ( $dataSeriesValues2 ) - 1 ) ,
$dataSeriesLabels2 ,
$xAxisTickValues2 ,
$dataSeriesValues2
) ;
$layout2 = new Layout ( ) ;
$layout2 -> setShowVal ( true ) ;
$layout2 -> setShowCatName ( true ) ;
$plotArea2 = new PlotArea ( $layout2 , [ $series2 ] ) ;
$title2 = new Title ( 'Test Donut Chart' ) ;
$chart2 = new Chart (
'chart2' ,
$title2 ,
null ,
$plotArea2 ,
true ,
DataSeries :: EMPTY_AS_GAP ,
null ,
null
) ;
$chart2 -> setTopLeftPosition ( 'I7' ) ;
$chart2 -> setBottomRightPosition ( 'P20' ) ;
$worksheet -> addChart ( $chart2 ) ;
$filename = "test" ;
header ( 'Content-Type: application/vnd.openxmlformats-officedocument.spreadsheetml.sheet;charset=UTF-8' ) ;
header ( 'Content-Disposition: attachment;filename="' . $filename . '.xlsx"' ) ;
header ( 'Cache-Control: max-age=0' ) ;
ob_end_clean ( ) ;
$writer = IOFactory :: createWriter ( $spreadsheet , 'Xlsx' ) ;
$writer -> setIncludeCharts ( true ) ;
$writer -> save ( "php://output" ) ;
$spreadsheet -> disconnectWorksheets ( ) ;
1 2 3 4 5 6 7 8 9 10 11 12 13 14 15 16 17 18 19 20 21 22 23 24 25 26 27 28 29 30 31 32 33 34 35 36 37 38 39 40 41 42 43 44 45 46 47 48 49 50 51 52 53 54 55 56 57 58 59 60 61 62 63 64 65 66 67 68 69 70 71 72 73 74 75 76 77 78 79 80 81 82 83 84 85 86 87 88 89 90 91 92 93 94 95 96 97 98 99 100 101 102 103 104 105 106 107
use PhpOffice\ PhpSpreadsheet\ Chart\ Chart ;
use PhpOffice\ PhpSpreadsheet\ Chart\ ChartColor ;
use PhpOffice\ PhpSpreadsheet\ Chart\ DataSeries ;
use PhpOffice\ PhpSpreadsheet\ Chart\ DataSeriesValues ;
use PhpOffice\ PhpSpreadsheet\ Chart\ GridLines ;
use PhpOffice\ PhpSpreadsheet\ Chart\ Layout ;
use PhpOffice\ PhpSpreadsheet\ Chart\ Legend as ChartLegend;
use PhpOffice\ PhpSpreadsheet\ Chart\ PlotArea ;
use PhpOffice\ PhpSpreadsheet\ Chart\ Properties ;
use PhpOffice\ PhpSpreadsheet\ Chart\ Title ;
use PhpOffice\ PhpSpreadsheet\ IOFactory ;
use PhpOffice\ PhpSpreadsheet\ Spreadsheet ;
$spreadsheet = new Spreadsheet ( ) ;
$worksheet = $spreadsheet -> getActiveSheet ( ) ;
$worksheet -> fromArray (
[
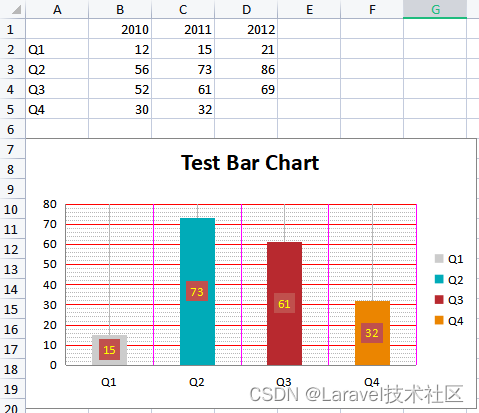
[ '' , 2010 , 2011 , 2012 ] ,
[ 'Q1' , 12 , 15 , 21 ] ,
[ 'Q2' , 56 , 73 , 86 ] ,
[ 'Q3' , 52 , 61 , 69 ] ,
[ 'Q4' , 30 , 32 , 0 ] ,
]
) ;
$colors = [
'cccccc' , '00abb8' , 'b8292f' , 'eb8500' ,
] ;
$dataSeriesLabels1 = [
new DataSeriesValues ( DataSeriesValues :: DATASERIES_TYPE_STRING , 'Worksheet!$C$1' , null , 1 ) ,
] ;
$xAxisTickValues1 = [
new DataSeriesValues ( DataSeriesValues :: DATASERIES_TYPE_STRING , 'Worksheet!$A$2:$A$5' , null , 4 ) ,
] ;
$dataSeriesValues1 = [
new DataSeriesValues ( DataSeriesValues :: DATASERIES_TYPE_NUMBER , 'Worksheet!$C$2:$C$5' , null , 4 , [ ] , null , $colors ) ,
] ;
$labelLayout = new Layout ( ) ;
$labelLayout
-> setShowVal ( true )
-> setLabelFontColor ( new ChartColor ( 'FFFF00' ) )
-> setLabelFillColor ( new ChartColor ( 'accent2' , null , 'schemeClr' ) ) ;
$dataSeriesValues1 [ 0 ] -> setLabelLayout ( $labelLayout ) ;
$series1 = new DataSeries (
DataSeries :: TYPE_BARCHART ,
null ,
range ( 0 , count ( $dataSeriesValues1 ) - 1 ) ,
$dataSeriesLabels1 ,
$xAxisTickValues1 ,
$dataSeriesValues1
) ;
$layout1 = new Layout ( ) ;
$layout1 -> setShowVal ( true ) ;
$layout1 -> setShowPercent ( true ) ;
$plotArea1 = new PlotArea ( $layout1 , [ $series1 ] ) ;
$legend1 = new ChartLegend ( ChartLegend :: POSITION_RIGHT , null , false ) ;
$title1 = new Title ( 'Test Bar Chart' ) ;
$chart1 = new Chart (
'chart1' ,
$title1 ,
$legend1 ,
$plotArea1 ,
true ,
DataSeries :: EMPTY_AS_GAP ,
null ,
null
) ;
$majorGridlinesY = new GridLines ( ) ;
$majorGridlinesY -> setLineColorProperties ( 'FF0000' ) ;
$minorGridlinesY = new GridLines ( ) ;
$minorGridlinesY -> setLineStyleProperty ( 'dash' , Properties :: LINE_STYLE_DASH_ROUND_DOT ) ;
$chart1
-> getChartAxisY ( )
-> setMajorGridlines ( $majorGridlinesY )
-> setMinorGridlines ( $minorGridlinesY ) ;
$majorGridlinesX = new GridLines ( ) ;
$majorGridlinesX -> setLineColorProperties ( 'FF00FF' ) ;
$minorGridlinesX = new GridLines ( ) ;
$minorGridlinesX -> activateObject ( ) ;
$chart1
-> getChartAxisX ( )
-> setMajorGridlines ( $majorGridlinesX )
-> setMinorGridlines ( $minorGridlinesX ) ;
$chart1 -> setTopLeftPosition ( 'A7' ) ;
$chart1 -> setBottomRightPosition ( 'H20' ) ;
$worksheet -> addChart ( $chart1 ) ;
$dataSeriesLabels2 = [
new DataSeriesValues ( DataSeriesValues :: DATASERIES_TYPE_STRING , 'Worksheet!$C$1' , null , 1 ) ,
] ;
$xAxisTickValues2 = [
new DataSeriesValues ( DataSeriesValues :: DATASERIES_TYPE_STRING , 'Worksheet!$A$2:$A$5' , null , 4 ) ,
] ;
$dataSeriesValues2 = [
$dataSeriesValues2Element = new DataSeriesValues ( DataSeriesValues :: DATASERIES_TYPE_NUMBER , 'Worksheet!$C$2:$C$5' , null , 4 ) ,
] ;
$dataSeriesValues2Element -> setFillColor ( $colors ) ;
$series2 = new DataSeries (
DataSeries :: TYPE_DONUTCHART ,
null ,
range ( 0 , count ( $dataSeriesValues2 ) - 1 ) ,
$dataSeriesLabels2 ,
$xAxisTickValues2 ,
$dataSeriesValues2
) ;
$layout2 = new Layout ( ) ;
$layout2 -> setShowVal ( true ) ;
$layout2 -> setShowCatName ( true ) ;
$layout2 -> setLabelFillColor ( new ChartColor ( 'FFFF00' ) ) ;
$plotArea2 = new PlotArea ( $layout2 , [ $series2 ] ) ;
$title2 = new Title ( 'Test Donut Chart' ) ;
$chart2 = new Chart (
'chart2' ,
$title2 ,
null ,
$plotArea2 ,
true ,
DataSeries :: EMPTY_AS_GAP ,
null ,
null
) ;
$chart2 -> setTopLeftPosition ( 'I7' ) ;
$chart2 -> setBottomRightPosition ( 'P20' ) ;
$worksheet -> addChart ( $chart2 ) ;
$filename = "test" ;
header ( 'Content-Type: application/vnd.openxmlformats-officedocument.spreadsheetml.sheet;charset=UTF-8' ) ;
header ( 'Content-Disposition: attachment;filename="' . $filename . '.xlsx"' ) ;
header ( 'Cache-Control: max-age=0' ) ;
ob_end_clean ( ) ;
$writer = IOFactory :: createWriter ( $spreadsheet , 'Xlsx' ) ;
$writer -> setIncludeCharts ( true ) ;
$writer -> save ( "php://output" ) ;
$spreadsheet -> disconnectWorksheets ( ) ;
1 2 3 4 5 6 7 8 9 10 11 12 13 14 15 16 17 18 19 20 21 22 23 24 25 26 27 28 29 30 31 32 33 34 35 36 37 38 39 40 41 42 43 44 45 46 47 48 49 50 51 52 53 54 55 56 57 58 59 60 61 62 63 64 65 66 67 68 69 70 71 72 73 74 75 76 77 78 79 80 81 82 83 84 85 86 87 88 89 90 91 92 93 94 95 96 97 98 99 100 101 102 103 104 105 106 107 108 109 110 111 112 113 114 115 116 117 118 119 120 121 122 123 124 125 126 127 128 129 130 131 132 133 134