-
萤火虫模糊回归算法(Matlab代码实现)
🍒🍒🍒欢迎关注🌈🌈🌈
📝个人主页:我爱Matlab
👍点赞➕评论➕收藏 == 养成习惯(一键三连)🌻🌻🌻🍌希望大家多多支持🍓~一起加油 🤗
💬语录:将来的我一定会感谢现在奋斗的自己!
🍁🥬🕒摘要🕒🥬🍁
萤火虫算法模拟了萤火虫的自然现象。真实的萤火虫自然地呈现出一种离散的闪烁模式,而萤火虫算法假设它们总是在发光。为了模拟萤火虫的这种闪烁行为,Yang Xin-She提出了了三条规则(Yang,2009):
(1)假设所有萤火虫都是雌雄同体的,因此一只萤火虫可能会被其他任何萤火虫吸引。
(2)萤火虫的亮度决定其吸引力的大小,较亮的萤火虫吸引较暗的萤火虫。如果没有萤火虫比被考虑的萤火虫更亮,它就会随机移动。
(3)函数的最优值与萤火虫的亮度成正比。✨🔎⚡运行结果⚡🔎✨


💂♨️👨🎓Matlab代码👨🎓♨️💂
clc;
clear;
warning('off');
% Data Loading
data=JustLoad();
% Generate Fuzzy Model
ClusNum=4; % Number of Clusters in FCM
%
fis=GenerateFuzzy(data,ClusNum);
%
%% Tarining FireFly Algorithm
FireFlyFis=FireFlyRegression(fis,data);%% Plot Fuzzy FireFly Results (Train - Test)
% Train Output Extraction
TrTar=data.TrainTargets;
TrainOutputs=evalfis(data.TrainInputs,FireFlyFis);
% Test Output Extraction
TsTar=data.TestTargets;
TestOutputs=evalfis(data.TestInputs,FireFlyFis);
% Train calc
Errors=data.TrainTargets-TrainOutputs;
MSE=mean(Errors.^2);RMSE=sqrt(MSE);
error_mean=mean(Errors);error_std=std(Errors);
% Test calc
Errors1=data.TestTargets-TestOutputs;
MSE1=mean(Errors1.^2);RMSE1=sqrt(MSE1);
error_mean1=mean(Errors1);error_std1=std(Errors1);
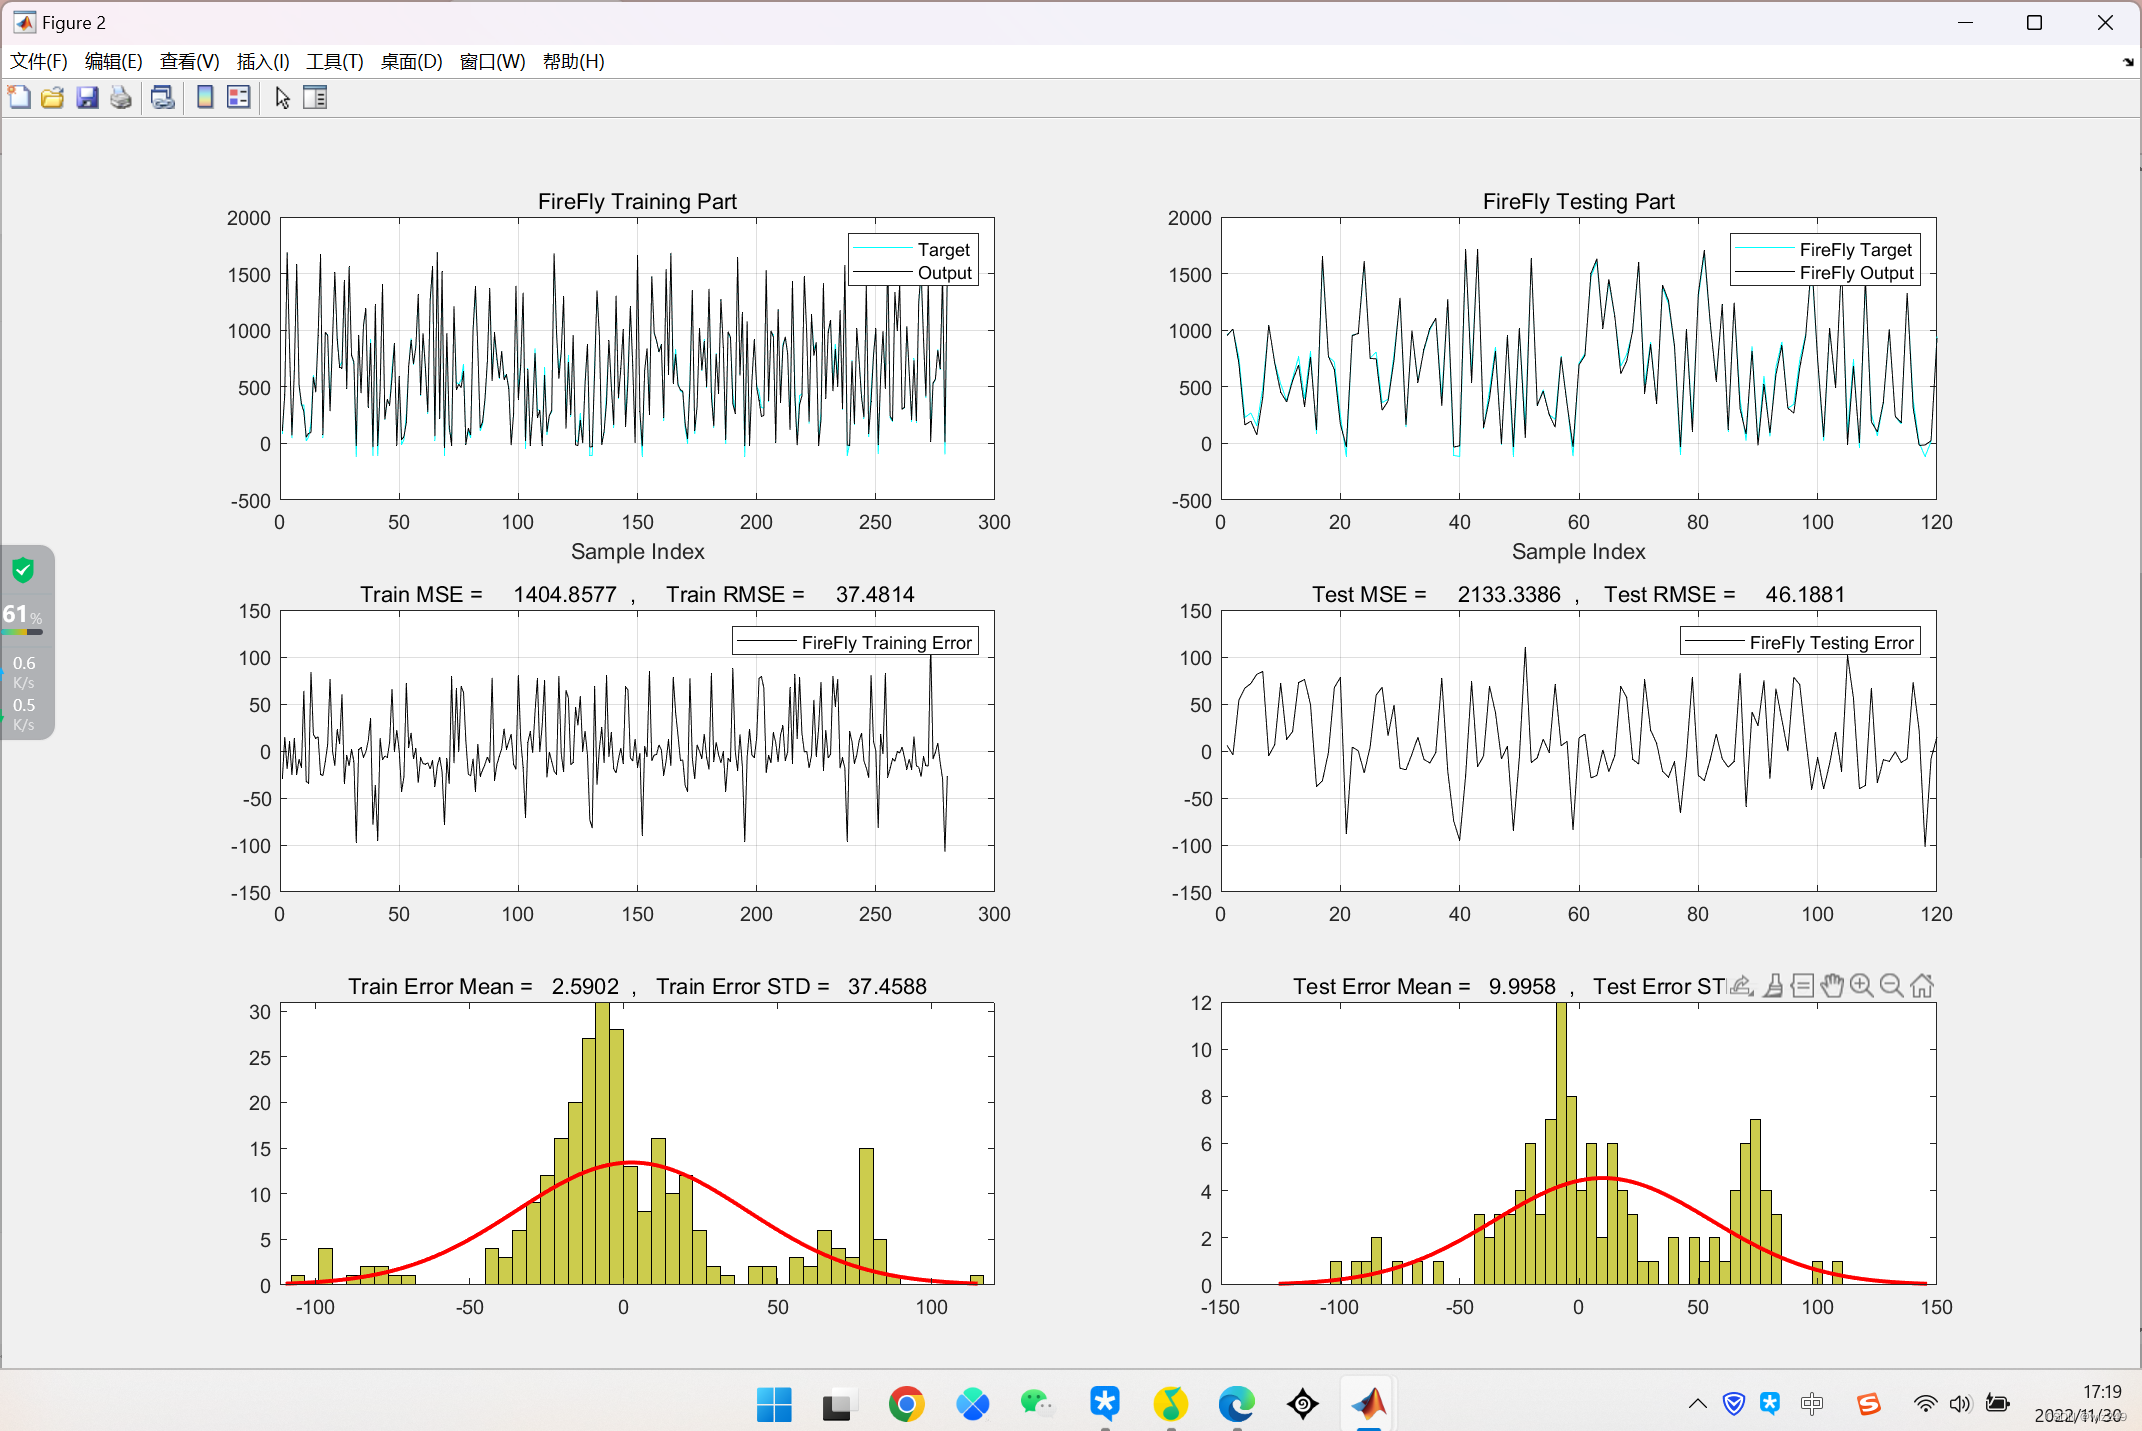
% Train
figure('units','normalized','outerposition',[0 0 1 1])
subplot(3,2,1);
plot(data.TrainTargets,'c');hold on;
plot(TrainOutputs,'k');legend('Target','Output');
title('FireFly Training Part');xlabel('Sample Index');grid on;
% Test
subplot(3,2,2);
plot(data.TestTargets,'c');hold on;
plot(TestOutputs,'k');legend('FireFly Target','FireFly Output');
title('FireFly Testing Part');xlabel('Sample Index');grid on;
% Train
subplot(3,2,3);
plot(Errors,'k');legend('FireFly Training Error');
title(['Train MSE = ' num2str(MSE) ' , Train RMSE = ' num2str(RMSE)]);grid on;
% Test
subplot(3,2,4);
plot(Errors1,'k');legend('FireFly Testing Error');
title(['Test MSE = ' num2str(MSE1) ' , Test RMSE = ' num2str(RMSE1)]);grid on;
% Train
subplot(3,2,5);
h=histfit(Errors, 50);h(1).FaceColor = [.8 .8 0.3];
title(['Train Error Mean = ' num2str(error_mean) ' , Train Error STD = ' num2str(error_std)]);
% Test
subplot(3,2,6);
h=histfit(Errors1, 50);h(1).FaceColor = [.8 .8 0.3];
title(['Test Error Mean = ' num2str(error_mean1) ' , Test Error STD = ' num2str(error_std1)]);%% Plot Just Fuzzy Results (Train - Test)
% Train Output Extraction
fTrainOutputs=evalfis(data.TrainInputs,fis);
% Test Output Extraction
fTestOutputs=evalfis(data.TestInputs,fis);
% Train calc
fErrors=data.TrainTargets-fTrainOutputs;
fMSE=mean(fErrors.^2);fRMSE=sqrt(fMSE);
ferror_mean=mean(fErrors);ferror_std=std(fErrors);
% Test calc
fErrors1=data.TestTargets-fTestOutputs;
fMSE1=mean(fErrors1.^2);fRMSE1=sqrt(fMSE1);
ferror_mean1=mean(fErrors1);ferror_std1=std(fErrors1);
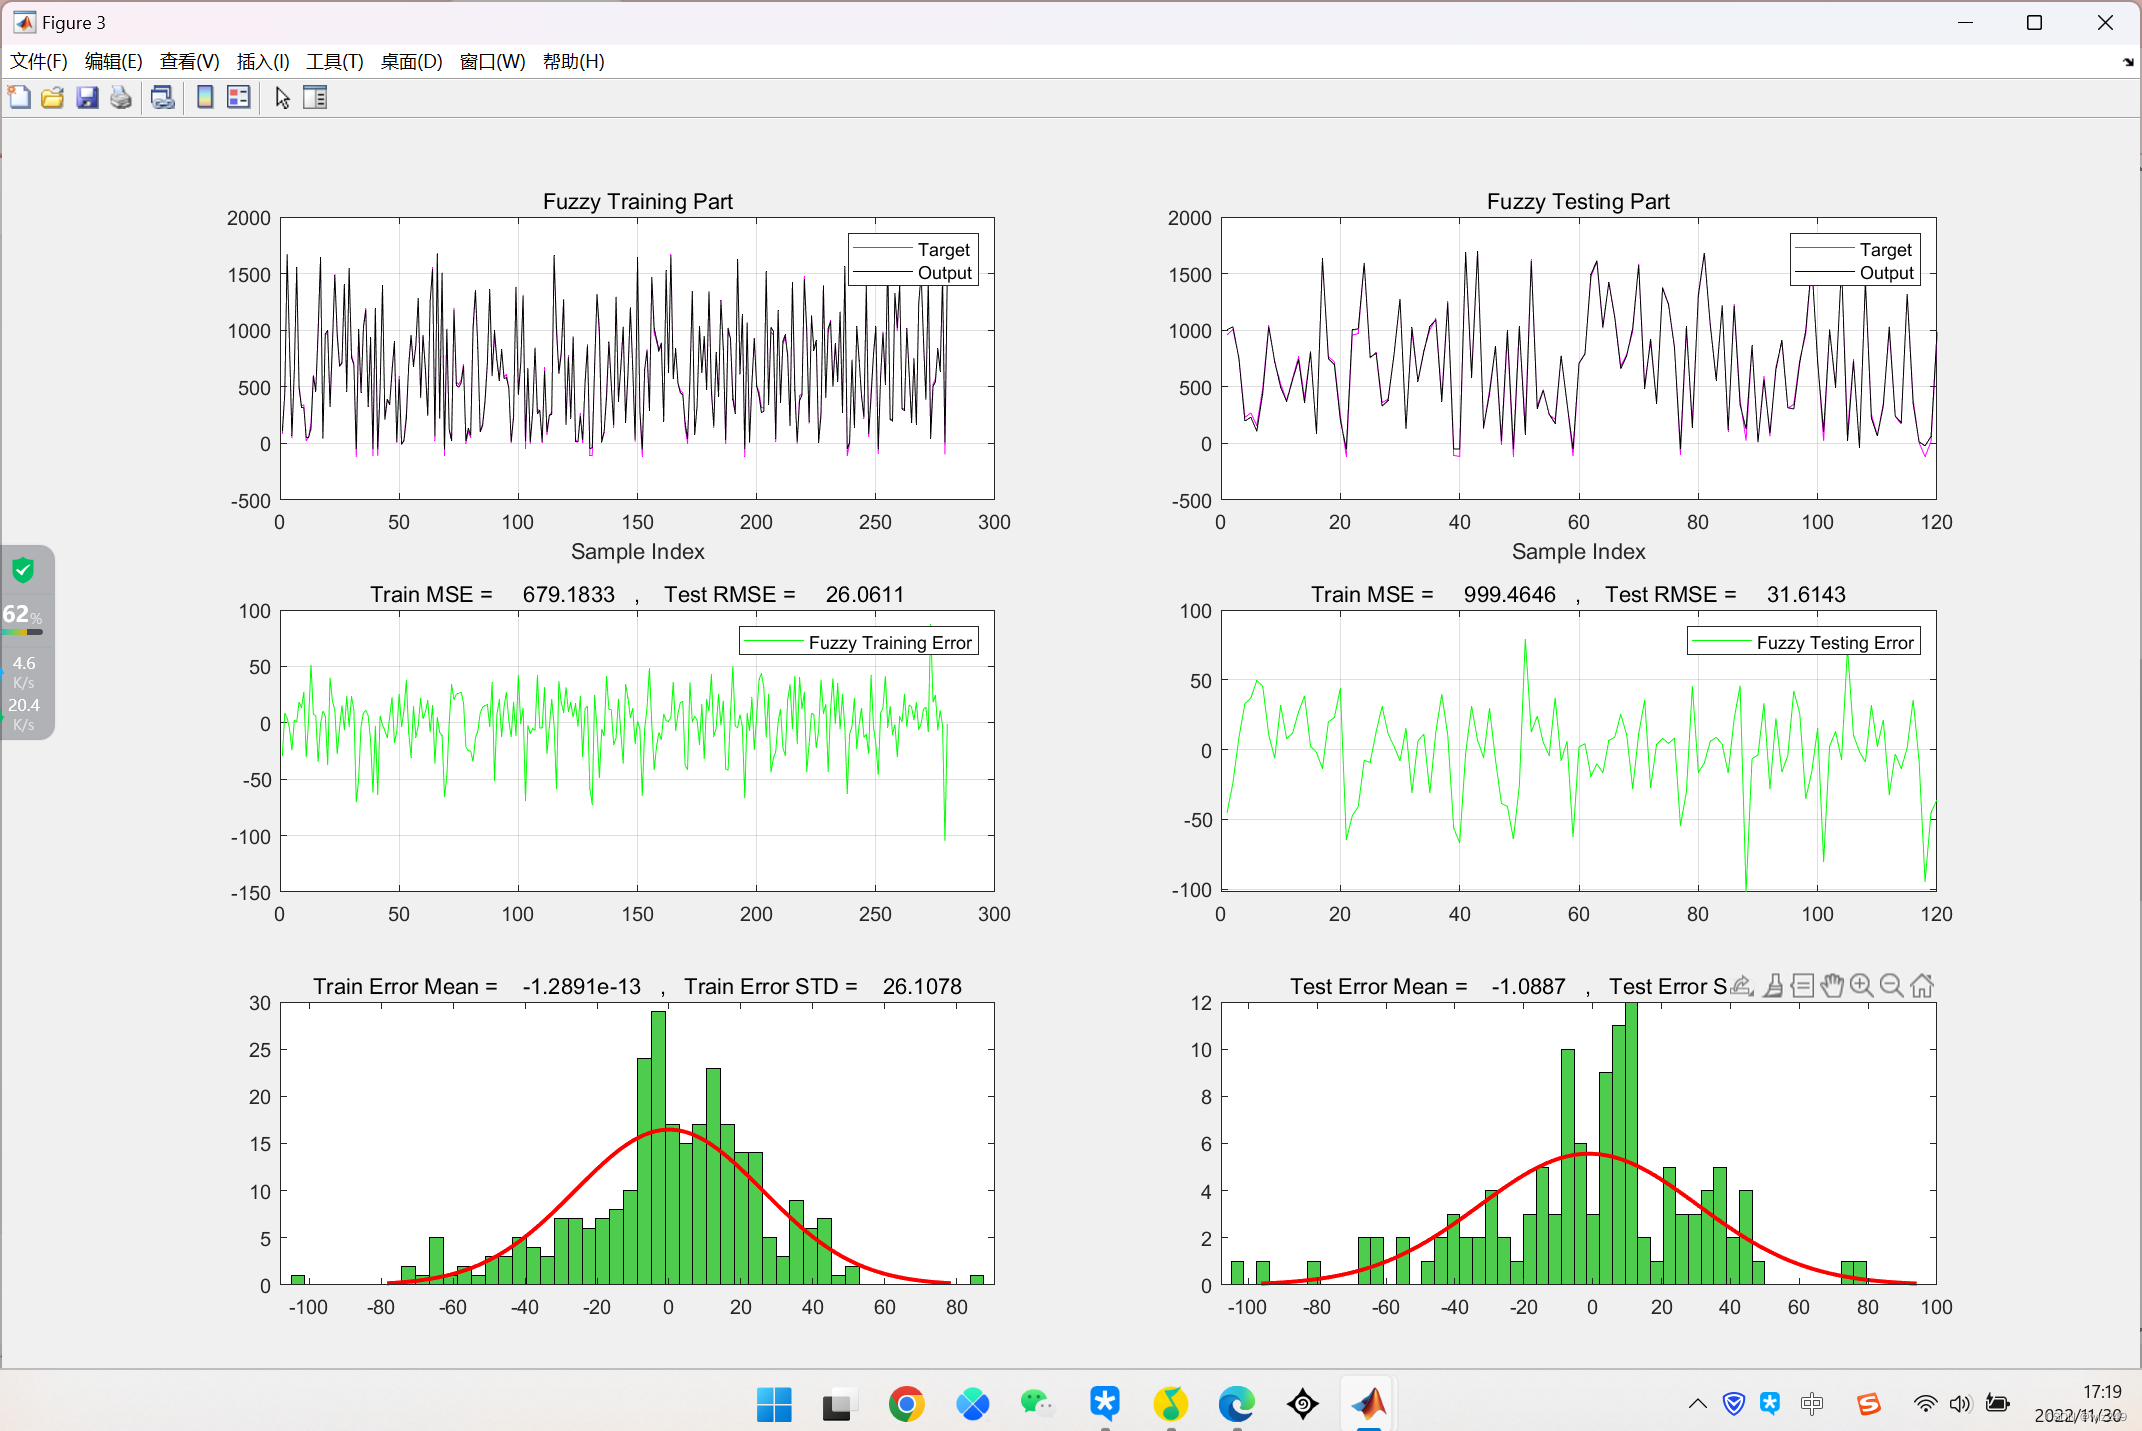
% Train
figure('units','normalized','outerposition',[0 0 1 1])
subplot(3,2,1);
plot(data.TrainTargets,'m');hold on;
plot(fTrainOutputs,'k');legend('Target','Output');
title('Fuzzy Training Part');xlabel('Sample Index');grid on;
% Test
subplot(3,2,2);
plot(data.TestTargets,'m');hold on;
plot(fTestOutputs,'k');legend('Target','Output');
title('Fuzzy Testing Part');xlabel('Sample Index');grid on;
% Train
subplot(3,2,3);
plot(fErrors,'g');legend('Fuzzy Training Error');
title(['Train MSE = ' num2str(fMSE) ' , Test RMSE = ' num2str(fRMSE)]);grid on;
% Test
subplot(3,2,4);
plot(fErrors1,'g');legend('Fuzzy Testing Error');
title(['Train MSE = ' num2str(fMSE1) ' , Test RMSE = ' num2str(fRMSE1)]);grid on;
% Train
subplot(3,2,5);
h=histfit(fErrors, 50);h(1).FaceColor = [.3 .8 0.3];
title(['Train Error Mean = ' num2str(ferror_mean) ' , Train Error STD = ' num2str(ferror_std)]);
% Test
subplot(3,2,6);
h=histfit(fErrors1, 50);h(1).FaceColor = [.3 .8 0.3];
title(['Test Error Mean = ' num2str(ferror_mean1) ' , Test Error STD = ' num2str(ferror_std1)]);%% Regression Plots
figure('units','normalized','outerposition',[0 0 1 1])
subplot(2,2,1)
[population2,gof] = fit(TrTar,TrainOutputs,'poly4');
plot(TrTar,TrainOutputs,'o',...
'LineWidth',1,...
'MarkerSize',6,...
'MarkerEdgeColor','g',...
'MarkerFaceColor',[0.9,0.1,0.1]);
title(['FireFly Train - R = ' num2str(1-gof.rmse)]);
xlabel('Train Target');
ylabel('Train Output');
hold on
plot(population2,'b-','predobs');
xlabel('Train Target');
ylabel('Train Output');
hold off
subplot(2,2,2)
[population2,gof] = fit(TsTar, TestOutputs,'poly4');
plot(TsTar, TestOutputs,'o',...
'LineWidth',1,...
'MarkerSize',6,...
'MarkerEdgeColor','g',...
'MarkerFaceColor',[0.9,0.1,0.1]);
title(['FireFly Test - R = ' num2str(1-gof.rmse)]);
xlabel('Test Target');
ylabel('Test Output');
hold on
plot(population2,'b-','predobs');
xlabel('Test Target');
ylabel('Test Output');
hold off
subplot(2,2,3)
[population2,gof] = fit(TrTar,fTrainOutputs,'poly4');
plot(TrTar,fTrainOutputs,'o',...
'LineWidth',1,...
'MarkerSize',6,...
'MarkerEdgeColor','b',...
'MarkerFaceColor',[0.3,0.9,0.2]);
title(['Fuzzy Train - R = ' num2str(1-gof.rmse)]);
xlabel('Train Target');
ylabel('Train Output');
hold on
plot(population2,'r-','predobs');
xlabel('Train Target');
ylabel('Train Output');
hold off
subplot(2,2,4)
[population2,gof] = fit(TsTar, fTestOutputs,'poly4');
plot(TsTar, fTestOutputs,'o',...
'LineWidth',1,...
'MarkerSize',6,...
'MarkerEdgeColor','b',...
'MarkerFaceColor',[0.3,0.9,0.2]);
title(['Fuzzy Test - R = ' num2str(1-gof.rmse)]);
xlabel('Test Target');
ylabel('Test Output');
hold on
plot(population2,'r-','predobs');
xlabel('Test Target');
ylabel('Test Output');
hold off📜📢🌈参考文献🌈📢📜
[1]王昕, 黄柯, 郑益慧,等. 基于萤火虫算法-广义回归神经网络的光伏发电功率组合预测[J]. 电网技术, 2017, 41(2):7.
-
相关阅读:
UE4创建一个左右摇摆的“喷泉”
【Arduino+ESP32专题】模拟I/O的使用——PWM
2023数维杯国际赛数学建模C题思路模型
Gradle多模块项目配置
【SparkSQL】数据的加载和保存、项目实战
电子学会C++编程等级考试2023年05月(二级)真题解析
【深度学习】吴恩达课程笔记(一)——深度学习概论、神经网络基础
APT攻击与防范
微波通信的分类
Python中requests模块源码分析:requests是如何调用urllib3的
- 原文地址:https://blog.csdn.net/weixin_66436111/article/details/128117699