-
点云梯度下采样
点云下采样又称点云精简。
均匀网格下采样
均匀网格下采样法是建立在空间包围盒精简算法之上对散乱点云快速简化的一种算法,其基本思想为:根据点云数据的密度确定最小三维网格(体素)的边长为 a ∗ b ∗ c a*b*c a∗b∗c,计算最小三维网格的重心,通过邻域搜索保留离重心点最近的点并删除其余的点。每个三维网格重心依据式下式进行计算。
X = ∑ i = 1 n x i n , Y = ∑ i = 1 n y i n , Z = ∑ i = 1 n z i n X=\frac{\sum_{i=1}^n x_i}{n}, \quad Y=\frac{\sum_{i=1}^n y_i}{n}, \quad Z=\frac{\sum_{i=1}^n z_i}{n} X=n∑i=1nxi,Y=n∑i=1nyi,Z=n∑i=1nzi
其中 n n n 表示最小三维网格中的点云数据量 [ 1 ] ^{[1]} [1]。原理类似与点云降采样(DownSampling这篇中所提到的体素网格下采样。
曲率下采样
对于上述的均匀下采样(体素下采样),随着体素尺寸的增大,采样后得到的点云将会丢失细节特征,如曲率较大处,相反,如果在曲率变化不大的地方采样过多点,会显得冗余。所以,在这种情况下基于曲率特征的点云采样方法更加合适。
采样思路如下:
Step1:使用局部曲面拟合法计算出每个待采样点 p i p_i pi 的曲率 H i H_i Hi,并计算点云整体的平均曲率作为曲率阈值 H t H_t Ht。
Step2:比较 H i H_i Hi 与曲率阈值 H t H_t Ht 的大小,如果小于曲率阈值 H t H_t Ht,则把采样点 p i p_i pi 划分到平缓区域,反之划分到陡峭区域。
Step3:采用均匀网格法对两个区域的点云进行精简(下采样),陡峭区域和平缓区域的边长阈值分别设置为 A A A 和 B B B ,并且 A < B AA<B [ 1 ] ^{[1]} [1]。梯度下采样
通过类比法,我们用有限元体网格节点梯度替代表面曲率,设计出一种基于梯度特征的节点点云下采样方法。
采样思路如下:
Step1:计算出每个待采样点 p i p_i pi 的梯度 G i G_i Gi,并计算节点点云整体的平均梯度作为梯度阈值 G t G_t Gt。
Step2:比较 G i G_i Gi 与梯度阈值 G t G_t Gt 大小,如果小于梯度阈值 G t G_t Gt,则把采样点 p i p_i pi 划分到节点属性变化剧烈区域,反之划分到节点属性变化缓慢区域。
Step3:采用均匀网格法对两个区域的节点点云进行精简(下采样),剧烈区域和缓慢区域的边长阈值分别设置为 A A A 和 B B B ,并且 A < B AA<B。代码实现
均匀网格下采样
均匀网格下采样,也就是体素下采样的python代码实现如下:
def voxel_filter(origin_points, leaf_size): """体素下采样""" filtered_points = [] # 计算边界点 x_min, y_min, z_min = np.amin(origin_points, axis = 0) # 计算x y z 三个维度的最值 x_max, y_max, z_max = np.amax(origin_points, axis = 0) # 计算 voxel grid维度 Dx = (x_max - x_min) // leaf_size + 1 Dy = (y_max - y_min) // leaf_size + 1 Dz = (z_max - z_min) // leaf_size + 1 # print("Dx x Dy x Dz is {} x {} x {}".format(Dx, Dy, Dz)) # 计算每个点的voxel索引,即确定每个点所被划分到的voxel h = [] # h 为保存索引的列表 for i in range(len(origin_points)): hx = (origin_points[i][0] - x_min) // leaf_size hy = (origin_points[i][1] - y_min) // leaf_size hz = (origin_points[i][2] - z_min) // leaf_size h.append(hx + hy * Dx + hz * Dx * Dy) # voxel索引填充顺序x-y-z h = np.array(h) # 筛选点 h_indice = np.argsort(h) # 返回h里面的元素按从小到大排序的索引 h_sorted = h[h_indice] begin = 0 for i in range(len(h_sorted)): if i == len(h_sorted) - 1: # 到最后一个体素的最后一个点 point_idx = h_indice[begin: i + 1] filtered_points.append(np.mean(origin_points[point_idx], axis = 0)) # 计算最后一个体素的采样点 continue if h_sorted[i] == h_sorted[i + 1]: continue else: point_idx = h_indice[begin: i + 1] filtered_points.append(np.mean(origin_points[point_idx], axis = 0)) begin = i + 1 # 把点云格式改成array,并对外返回 filtered_points = np.array(filtered_points, dtype = np.float64) return filtered_points- 1
- 2
- 3
- 4
- 5
- 6
- 7
- 8
- 9
- 10
- 11
- 12
- 13
- 14
- 15
- 16
- 17
- 18
- 19
- 20
- 21
- 22
- 23
- 24
- 25
- 26
- 27
- 28
- 29
- 30
- 31
- 32
- 33
- 34
- 35
- 36
- 37
- 38
- 39
- 40
- 41
上面代码参考这篇文章【点云学习】Python实现点云体素下采样(Voxel Filter)中的代码。原文中的代码在迭代采样体素过程中,存在无法在最后一个体素中采样的问题。所以,我在迭代中添加了如下语句,进行完善。
if i == len(h_sorted) - 1: # 到最后一个体素的最后一个点 point_idx = h_indice[begin: i + 1] filtered_points.append(np.mean(origin_points[point_idx], axis = 0)) # 计算最后一个体素的采样点 continue- 1
- 2
- 3
- 4
梯度下采样
结合上述的算法流程,梯度下采样python代码实现如下。
def gradient_downsampling(origin_points, G, a, b): """gradient downsampling :param origin_points: 源点云 :param G: 点云梯度值 :param a: 梯度变化剧烈区域采样体素尺寸 :param b: 梯度变化缓慢区域采样体素尺寸 :return: 采样点云 """ filtered_points, a_points, b_points = [], [], [] # 将点与其对应梯度绑定 # origin_points = np.hstack((origin_points, G.reshape(-1, 1))) # Step1: 将平均梯度作为梯度阈值 G_t = np.mean(G) # Step2: 根据梯度划分点云为a_points和b_points两个区域 for i, G_i in enumerate(G): if G_i > G_t: a_points.append(origin_points[i]) else: b_points.append(origin_points[i]) # Step3: 采样体素下采样对a_points和b_points两个区域进行采样 a_filtered = voxel_filter(np.array(a_points), a, near = True) b_filtered = voxel_filter(np.array(b_points), b, near = True) filtered_points = np.vstack((a_filtered, b_filtered)) return filtered_points- 1
- 2
- 3
- 4
- 5
- 6
- 7
- 8
- 9
- 10
- 11
- 12
- 13
- 14
- 15
- 16
- 17
- 18
- 19
- 20
- 21
- 22
- 23
- 24
- 25
- 26
- 27
为了满足采样点为源点云中的点,即采样距离体素重心最近的点,改写voxel_filter函数如下。
def voxel_filter(origin_points, leaf_size, near = False): """体素下采样""" filtered_points = [] if near: # 构建KD-Tree寻找最近点 from scipy import spatial tree = spatial.KDTree(data = origin_points[:, :3]) # 计算边界点 x_min, y_min, z_min = np.amin(origin_points[:, :3], axis = 0) # 计算x y z 三个维度的最值 x_max, y_max, z_max = np.amax(origin_points[:, :3], axis = 0) # 计算 voxel grid维度 Dx = (x_max - x_min) // leaf_size + 1 Dy = (y_max - y_min) // leaf_size + 1 Dz = (z_max - z_min) // leaf_size + 1 # print("Dx x Dy x Dz is {} x {} x {}".format(Dx, Dy, Dz)) # 计算每个点的voxel索引,即确定每个点所被划分到的voxel h = [] # h 为保存索引的列表 for i in range(len(origin_points)): hx = (origin_points[i][0] - x_min) // leaf_size hy = (origin_points[i][1] - y_min) // leaf_size hz = (origin_points[i][2] - z_min) // leaf_size h.append(hx + hy * Dx + hz * Dx * Dy) # voxel索引填充顺序x-y-z h = np.array(h) # 筛选点 h_indice = np.argsort(h) # 返回h里面的元素按从小到大排序的索引 h_sorted = h[h_indice] begin = 0 for i in range(len(h_sorted)): point_idx = h_indice[begin: i + 1] if i == len(h_sorted) - 1: # 到最后一个体素的最后一个点 if near: query_point = np.mean(origin_points[point_idx], axis = 0)[:3] dist, ind = tree.query(query_point, k = 1) filtered_points.append(origin_points[ind]) else: filtered_points.append(np.mean(origin_points[point_idx], axis = 0)) # 计算最后一个体素的采样点 continue if h_sorted[i] == h_sorted[i + 1]: continue else: if near: query_point = np.mean(origin_points[point_idx], axis = 0)[:3] dist, ind = tree.query(query_point, k = 1) filtered_points.append(origin_points[ind]) else: filtered_points.append(np.mean(origin_points[point_idx], axis = 0)) begin = i + 1 # 把点云格式改成array,并对外返回 filtered_points = np.array(filtered_points, dtype = np.float64) return filtered_points- 1
- 2
- 3
- 4
- 5
- 6
- 7
- 8
- 9
- 10
- 11
- 12
- 13
- 14
- 15
- 16
- 17
- 18
- 19
- 20
- 21
- 22
- 23
- 24
- 25
- 26
- 27
- 28
- 29
- 30
- 31
- 32
- 33
- 34
- 35
- 36
- 37
- 38
- 39
- 40
- 41
- 42
- 43
- 44
- 45
- 46
- 47
- 48
- 49
- 50
- 51
- 52
- 53
- 54
- 55
通过构建待采样点云的KD-Tree实现最邻近搜索。
测试结果
我们对比测试同一待采样点云的体素下采样和梯度下采样,测试代码如下:
input_points = np.hstack((points, gradient)) drawPointCloud(input_points, color = True) # 体素下采样 Vsample_points = voxel_filter(input_points, 5) drawPointCloud(Vsample_points, color = True) # 梯度下采样 Gsample_points = gradient_downsampling(input_points, gradient, 2, 5) drawPointCloud(Gsample_points, color = True)- 1
- 2
- 3
- 4
- 5
- 6
- 7
- 8
这里我们通过使用open3d库进行点云可视化。
def drawPointCloud(points, color = False): import open3d as o3d cloud = o3d.geometry.PointCloud() cloud.points = o3d.utility.Vector3dVector(points[:, :3]) print(len(cloud.points)) if not color: # 所有点统一颜色 cloud.paint_uniform_color([241 / 255, 135 / 255, 184 / 255]) else: # 颜色映射 colors = np.zeros([points.shape[0], 3]) color_max = np.max(points[:, 3]) color_min = np.min(points[:, 3]) delta_c = abs(color_max - color_min) / (255 * 2) for j in range(points.shape[0]): color_n = (points[:, 3][j] - color_min) / delta_c if color_n <= 255: colors[j, :] = [0, 1 - color_n / 255, 1] else: colors[j, :] = [(color_n - 255) / 255, 0, 1] cloud.colors = o3d.utility.Vector3dVector(colors) o3d.visualization.draw_geometries([cloud])- 1
- 2
- 3
- 4
- 5
- 6
- 7
- 8
- 9
- 10
- 11
- 12
- 13
- 14
- 15
- 16
- 17
- 18
- 19
- 20
- 21
- 22
- 23
测试结果如下图所示。


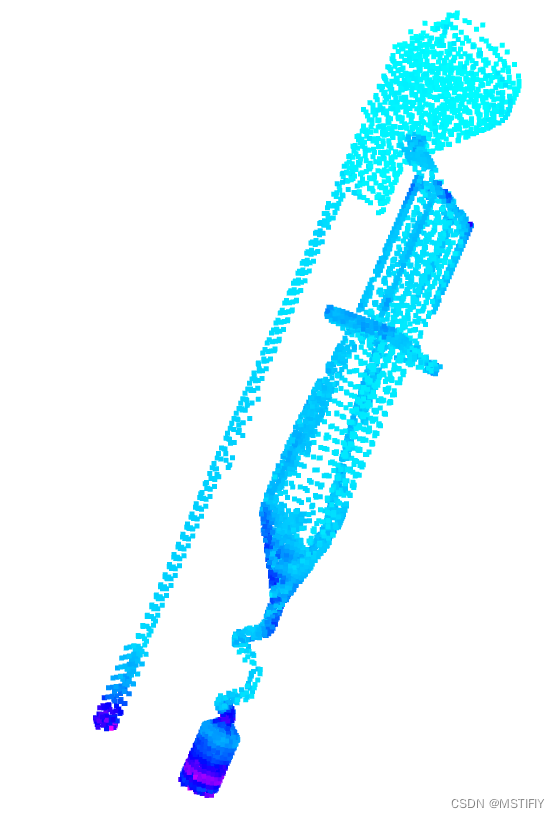
PinkCAx中测试结果如下。

参考
[1] 李国远,梁周雁,石信肖,等. 基于曲率特征约束的激光点云精简方法研究[J]. 计算机与数字工程,2020,48(8):2034-2037,2063. DOI:10.3969/j.issn.1672-9722.2020.08.042.
[2] 【点云学习】Python实现点云体素下采样(Voxel Filter)
[3] 采用Open3d绘制高度颜色点云图 -
相关阅读:
吃瓜神奇!企查查、天眼查、天眼销,到底哪家强?
开源聚力,共创未来 | 麒麟信安祝贺openKylin首个体验版正式发布!
Centos7 ELK 8.2 集群配置
基于Matlab卡尔曼滤波的IMU和GPS组合导航数据融合(附上源码+数据)
uniapp h5 部署
Java的选择排序、冒泡排序、插入排序
Axure RP PC电商平台Web端交互原型模板
什么是pmp考试?
第一个 flet 应用
谷粒商城实战笔记-142-性能压测-压力测试-Apache JMeter安装使用
- 原文地址:https://blog.csdn.net/qq_39784672/article/details/128062714