-
用python gdal裁剪栅格数据提取添加xy经纬度和栅格值
用python gdal裁剪栅格数据提取添加xy经纬度和栅格值
问题:把遥感影像转为一张表。
现有一全球经济作物数据alfalfa的产量。

alfalfa是一种亚洲西南部多年生草本植物,是重要的经济作物。在图中也可以看到,主要分布在热带和南美洲。

我们想把影像转表,即经纬度、栅格值(苜蓿产量)
上述功能在ArcGIS中是这样实现的。

对于我上述全球影像来说,栅格转点需要6分钟。添加字段和计算几何都需要花费更多的时间。
采用python的gdal方法,首先进行影像裁剪。直接上代码:
dataset = gdal.Open("D:/work/0318/Suitability Raster files/Suitability Raster files/High input/high_banana_plaintain.tif") output_raster=r'D:/work/0318/Suitability Raster files/Suitability Raster files/High_mask/high_banana_plaintain_mask.tif' input_shape = r'D:/work/0318/shp/Africa.shp' # 开始裁剪 ds = gdal.Warp(output_raster, dataset, format = 'GTiff', cutlineDSName = input_shape, cutlineWhere="FIELD = 'whatever'", dstNodata = -90)- 1
- 2
- 3
- 4
- 5
- 6
- 7
- 8
- 9
- 10
- 11
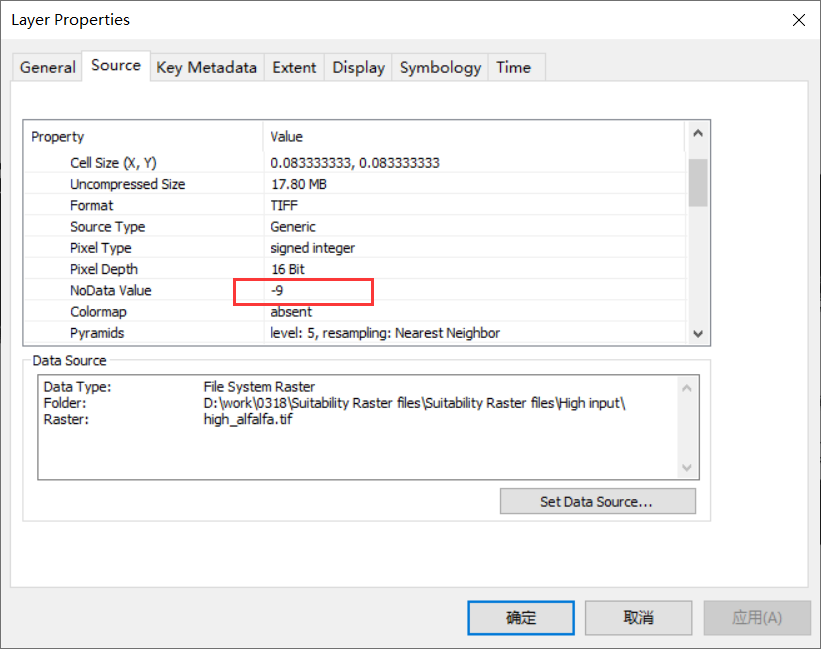
这里我设置nodata为负值,是我本来影像的nodata值,可以在GIS查看
然后再进行统计:
import time from osgeo import gdal import numpy as np import pandas as pd import os def rasterToPoints(rasterfile, nodata=None, v_name=None): """ :param rasterfile: 待执行栅格转点的栅格文件 :param nodata:栅格中的无数据值,默认取栅格的最小值 :param v_name:导出表格中栅格值所在列的名称,默认为栅格的文件名 :return:x、y、value """ # numpy禁用科学计数法,pandas中存储浮点型时只保留四位小数 np.set_printoptions(suppress=True) pd.set_option('display.float_format', lambda x: '%.4f' % x) rds = gdal.Open(rasterfile) # type:gdal.Dataset if rds.RasterCount != 1: print("Warning, RasterCount > 1") cols = rds.RasterXSize rows = rds.RasterYSize band = rds.GetRasterBand(1) # type:gdal.Band transform = rds.GetGeoTransform() print(transform) x_origin = transform[0] y_origin = transform[3] pixel_width = transform[1] pixel_height = transform[5] if (pixel_height + pixel_width) != 0: print("Warning, pixelWidth != pixelHeight") # 读取栅格 values = np.array(band.ReadAsArray()) x = np.arange(x_origin + pixel_width * 0.5, x_origin + (cols + 0.5) * pixel_width, pixel_width) y = np.arange(y_origin + pixel_height*0.5, y_origin + (rows+0.5) * pixel_height, pixel_height) px, py = np.meshgrid(x, y) if v_name is None: v_name = os.path.splitext(os.path.split(rasterfile)[1])[0] dataset = {"x": px.ravel(), "y": py.ravel(), v_name: values.ravel()} df_temp = pd.DataFrame(dataset, dtype="float32") # 删除缺失值 if nodata is None: nodata = df_temp[v_name].min() df_temp = df_temp[df_temp[v_name] != nodata] else: df_temp = df_temp[df_temp[v_name] != nodata] df_temp.index = range(len(df_temp)) return df_temp if __name__ == "__main__": # 禁用科学计数法 np.set_printoptions(suppress=True) pd.set_option('display.float_format', lambda x: '%.4f' % x) # 执行栅格转点,并计时 s = time.time() # in_tif是输入栅格,刚才裁剪的结果 in_tif = r"D:/work/0318/Suitability Raster files/Suitability Raster files/High_mask/high_banana_plaintain_mask.tif" outfile = rasterToPoints(in_tif, v_name="high_banana_plaintain") # v_name是你自己定义的栅格字段列名称 outfile.to_csv("high_banana_plaintain.csv") # 导出csv文件 e = time.time() print("time used {0}s".format(e-s))- 1
- 2
- 3
- 4
- 5
- 6
- 7
- 8
- 9
- 10
- 11
- 12
- 13
- 14
- 15
- 16
- 17
- 18
- 19
- 20
- 21
- 22
- 23
- 24
- 25
- 26
- 27
- 28
- 29
- 30
- 31
- 32
- 33
- 34
- 35
- 36
- 37
- 38
- 39
- 40
- 41
- 42
- 43
- 44
- 45
- 46
- 47
- 48
- 49
- 50
- 51
- 52
- 53
- 54
- 55
- 56
- 57
- 58
- 59
- 60
- 61
- 62
- 63
- 64
- 65
- 66
- 67
- 68
- 69
成功了。
看看统计结果
cs = pd.read_csv('high_banana_plaintain.csv') cs- 1
- 2
Unnamed: 0 x y high_banana_plaintain 0 0 9.3750 37.2917 0.0000 1 1 9.4583 37.2917 0.0000 2 2 9.5417 37.2917 0.0000 3 3 9.6250 37.2917 0.0000 4 4 9.7083 37.2917 0.0000 … … … … … 360807 360807 19.7083 -34.7917 0.0000 360808 360808 19.7917 -34.7917 0.0000 360809 360809 19.8750 -34.7917 0.0000 360810 360810 19.9583 -34.7917 0.0000 360811 360811 20.0417 -34.7917 0.0000 360812 rows × 4 columns
很完美。
-
相关阅读:
基于Echarts实现大屏数据可视化物虚拟数据统计
人工智能之机器学习
SQL-LABS
Python环境配置及基础用法&Pycharm库安装与背景设置及避免Venv文件夹
DAY05_瑞吉外卖——新增套餐&套餐分页查询&删除套餐&短信发送&手机验证码登录
9.3 挂钩API技术(HOOK API)
DLS-20型双位置继电器 220VDC
uni-app微信小程序tab切换demo
互动营销类游戏开发小程序游戏开发
卷积神经网络基础篇
- 原文地址:https://blog.csdn.net/wlh2067/article/details/127951376
