-
性能测试-linux-top/vmstat/dstat命令,闭着眼睛也要背出来
目录
Linux系统差异化
Ubuntu安装应用
.deb可以直接安装的软件
安装:
sudo dpkg -i xxx.deb 或者
apt\apt-get
卸载:-r
CentOS安装应用
.rpm可以直接安装的软件
安装:
rpm -ivh xxx.rpm 或者
yum install xxx.rpm -y(首选,可以自动下载相关依赖文件)
Linux通用安装,tar.gz包
.tar.gz,是这种类型的安装包
.tgz,是这种类型的安装包
系统需要有gcc
解压后的包中:./configure
再执行,make
再执行,make install
Linux系统帮助命令 help/man/info
ps --help 获取帮助,大部分命令都有
man ps 获取帮助比help多一些信息,并不是所有命令都有
info ps 获取帮助,非常详细的,但命令比较少
Linux系统中树状结构查看文件
yum install tree -y
tree -L 1 /opt #指定路径文件层级深度为:1级目录
tree -L 1 #当前路径下的,文件层级深度为:1级目录
Linux系统中文件类型区分与权限
- lrwxrwxrwx. 1 root root 7 11月 27 2020 bin -> usr/bin
- dr-xr-xr-x. 5 root root 4096 11月 27 2020 boot
- -rw-r--r--. 1 root root 393 4月 8 2020 os-release
第1个:文件类型:
l:连接
d:文件夹
-:文件
第2、3、4、5、6、7、8、9、10文件权限:
r:读=4
w:写=2
x:执行=1
三个为一组
第一组:所属用户(User)
第二组:所属组(Group)
第三组:其他(Other)
第11个:连接占用数
第12个:所属用户
第13个:所属组
第14个:大小
第15个:日期时间
第16个:文件名
lrwxrwxrwx. 1 root root 7 11月 27 2020 bin -> usr/bin三个组都可以 读、写、执行
dr-xr-xr-x. 5 root root 4096 11月 27 2020 boot第一组:可以读、执行
第二组:可以读、执行
第三组:可以读、执行
-rw-r--r--. 1 root root 393 4月 8 2020 os-release第一组:可以读、写
第二组:只读
第三组:只读
-rw-r--r--. 1 root root 393 4月 8 2020 os-release改变第一个用户权限
第一组:可读、写、执行
第二组:只读
第三组:只读
chmod 744 os-release
-rwxr--r--. 1 root root 393 4月 8 2020 os-release改变所有用户权限
第一组:可读、写、执行
第二组:可读、写、执行
第三组:可读、写、执行
chmod 777 os-release
Linux系统中都有哪些文件夹及其作用
├── bin -> usr/bin # 存放linux系统中可用的命令
├── boot # linux系统核心文件
├── dev # linux外置设备
├── etc # 系统管理所需要的,所有配置文件
├── home # 用户,跟目录
├── lib -> usr/lib
├── lib64 -> usr/lib64
├── media # 自动识别的外设
├── mnt # 用户临时挂载外部文件系统
├── opt # 主机额外安装的软件目录
├── proc # process进程,虚拟文件系统
├── root # 超级管理员主目录
├── run # 临时启动信息
├── sbin -> usr/sbin
├── srv # 服务启动,需要提取的数据
├── sys # 系统文件记录内核设备
├── tmp # 临时文件
├── usr # 用户共享程序文件夹
└── var # 不断扩充的文件夹,如日志
- [root@centos7 /]# tree -L 1
- .
- ├── bin -> usr/bin # 存放linux系统中可用的命令
- ├── boot # linux系统核心文件
- ├── dev # linux外置设备
- ├── etc # 系统管理所需要的,所有配置文件
- ├── home # 用户,跟目录
- ├── lib -> usr/lib
- ├── lib64 -> usr/lib64
- ├── media # 自动识别的外设
- ├── mnt # 用户临时挂载外部文件系统
- ├── opt # 主机额外安装的软件目录
- ├── proc # process进程,虚拟文件系统
- ├── root # 超级管理员主目录
- ├── run # 临时启动信息
- ├── sbin -> usr/sbin
- ├── srv # 服务启动,需要提取的数据
- ├── sys # 系统文件记录内核设备
- ├── tmp # 临时文件
- ├── usr # 用户共享程序文件夹
- └── var # 不断扩充的文件夹,如日志
Linux性能测试分析-TOP命令(重点)
查询linux系统资源命令top,性能测试95%会使用的
可以看到每个进程使用情况 (重点)
服务资源监控中,CPU的使用率,指的是所有的CPU核心(4核400%、8核800%)的总使用率
比如一台4核主机,资源利用不超过80%,也就是load average平均要在3.2以下,否则负载高
load average:CPU数量*80%(这个数一个平均值,我们简单计算一下)
Linux系统top命令分析
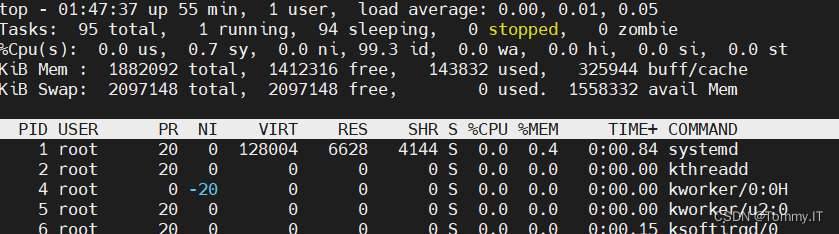
top - 01:50:43 up 58 min, 1 user, load average: 0.00, 0.01, 0.05
Tasks: 95 total, 1 running, 94 sleeping, 0 stopped, 0 zombie
%Cpu(s): 0.0 us, 1.0 sy, 0.0 ni, 99.0 id, 0.0 wa, 0.0 hi, 0.0 si, 0.0 st
KiB Mem : 1882092 total, 1412316 free, 143832 used, 325944 buff/cache
KiB Swap: 2097148 total, 2097148 free, 0 used. 1558332 avail MemLinux系统top命令帮助
- Help for Interactive Commands - procps-ng version 3.3.10
- Window 1:Def: Cumulative mode Off. System: Delay 3.0 secs; Secure mode Off.
- Z,B,E,e Global: 'Z' colors; 'B' bold; 'E'/'e' summary/task memory scale
- #'Z',颜色设置,'B',字体加粗;'E'系统内存单位转,'e'进程内存单位转换
- l,t,m Toggle Summary: 'l' load avg; 't' task/cpu stats; 'm' memory info
- 0,1,2,3,I Toggle: '0' zeros; '1/2/3' cpus or numa node views; 'I' Irix mode
- f,F,X Fields: 'f'/'F' add/remove/order/sort; 'X' increase fixed-width
- #设置列表
- L,&,<,> . Locate: 'L'/'&' find/again; Move sort column: '<'/'>' left/right
- R,H,V,J . Toggle: 'R' Sort; 'H' Threads; 'V' Forest view; 'J' Num justify
- #'R' 排序; 'H' 显示线程; 'V' 树状结构显示; 'J' 列表数字(左右对齐)
- c,i,S,j . Toggle: 'c' Cmd name/line; 'i' Idle; 'S' Time; 'j' Str justify
- x,y . Toggle highlights: 'x' sort field; 'y' running tasks
- z,b . Toggle: 'z' color/mono; 'b' bold/reverse (only if 'x' or 'y')
- u,U,o,O . Filter by: 'u'/'U' effective/any user; 'o'/'O' other criteria
- n,#,^O . Set: 'n'/'#' max tasks displayed; Show: Ctrl+'O' other filter(s)
- #'n'+5 设置最大显示条数,显示CPU资源使用率,从到低排序,#'n'+0还原
- C,... . Toggle scroll coordinates msg for: up,down,left,right,home,end
- k,r Manipulate tasks: 'k' kill; 'r' renice
- d or s Set update interval
- #设置刷新时间,默认3秒
- W,Y Write configuration file 'W'; Inspect other output 'Y'
- q Quit
- ( commands shown with '.' require a visible task display window )
- Press 'h' or '?' for help with Windows,
- Type 'q' or <Esc> to continue
top - 01:48:10 当前系统时间 up 56 min 系统从启动到现在运行了多久,越长越好 1 user 有多少个终端连接了linux系统 load average: 0.00, 0.01, 0.05 系统平均负载,数字越大越繁忙
第一个:系统过去1分钟平均负载;3.2>1,系统负载在上升,可能会继续上升
第二个:系统过去5分钟平均负载;1<3.2,系统负载在下降,可能会继续下降
第三个:系统过去15分钟平均负载;
%Cpu(s): 0.0 us, 1.0 sy, 0.0 ni, 99.0 id, 0.0 wa, 0.0 hi, 0.0 si, 0.0 st CPU的繁忙时间 = us + sy + ni + hi + si + st + wa(部分)
CPU的空间时间 = id + wa(部分CPU空间时间)
查看所有CPU,按1
Tasks: 95 total, 1 running, 94 sleeping, 0 stopped, 0 zombie (按H切换为,Threads,线程)
Tasks: 95 total,系统启动的总任务数(进程)
1 running,当前有多少个进程\线程,正在运行
94 sleeping,当前有多少个进程\线程,正在休眠
0 stopped,当前有多少个进程\线程,停止
0 zombie当前有多少个进程\线程,是僵尸线程\进程
每个1个进程,至少有1线程,所以总的线程数大于进程数
对照,进程列表的S列
R:运行
S:休眠
T:停止
Z:僵尸

KiB Mem : 1882092 total, 1412316 free, 143832 used, 325944 buff/cache 1882092 total,整个内存的大小
1412316 free, 内存上空闲内存大小
143832 used,已使用的内存大小
325944 buff/cache,缓冲(磁盘虚拟出来的空间,加快读磁盘速度)缓存(cup缓存+内存缓虚拟出来的,存加快磁盘写入速度)
KiB Swap: 2097148 total, 2097148 free, 0 used. 1558332 avail Mem Swap:交换分区,是磁盘虚拟出来的,会比内存条大,内存不足的是时候就会使用,将其他占用内存的转到swap,swap再转内存,临时扩大了内存空间
1558332 avail Mem,真实可用内存大小
Linux系统中的负载组成
主要有2部分组成:1.CUP负载,2.IO负载
系统负载 = CPU负载 + IO负载
CPU负载高,系统负载就高
IO负载高,系统负载就高
Linux系统中的CPU负载
CPU负载 = CPU繁忙时间 + CPU空闲时间的比
Linux系统CPU中的繁忙时间
%Cpu(s): 0.0 us, 1.0 sy, 0.0 ni, 99.0 id, 0.0 wa, 0.0 hi, 0.0 si, 0.0 st
CPU的繁忙时间 = us + sy + ni + hi + si + st + wa(部分)
CPU的空间时间 = id + wa(部分CPU空间时间)
us:用户态计算,占用CPU的时间比。(例如:运算简单的加减乘除的时间消耗)
sy:系统态计算,占用CPU的时间比。(例如:操作打开系统文件动作的时间消耗)
ni:进程优先级切换,占用CPU的时间比。
wa:CPU等待资源,占用CPU的时间比。(等待,休息)
hi:hardware interrupt 硬件中断,占用CPU的时间比。
si:software interrupt 软件中断,占用CPU的时间比。
st:管理CPU任务,占用CPU的时间比。
id:idle CPU空闲时间,占用CPU的时间比。
Linux系统中的IO负载
IO负载 = IO繁忙时间 + IO空闲时间的比
CPU使用率数据中,会在wa上体现出来(比如:等待资源,等待读写数据)wa值越大IO越繁忙
Linux系统IO中的繁忙时间
磁盘负载 + 外设负载 + 网络负载
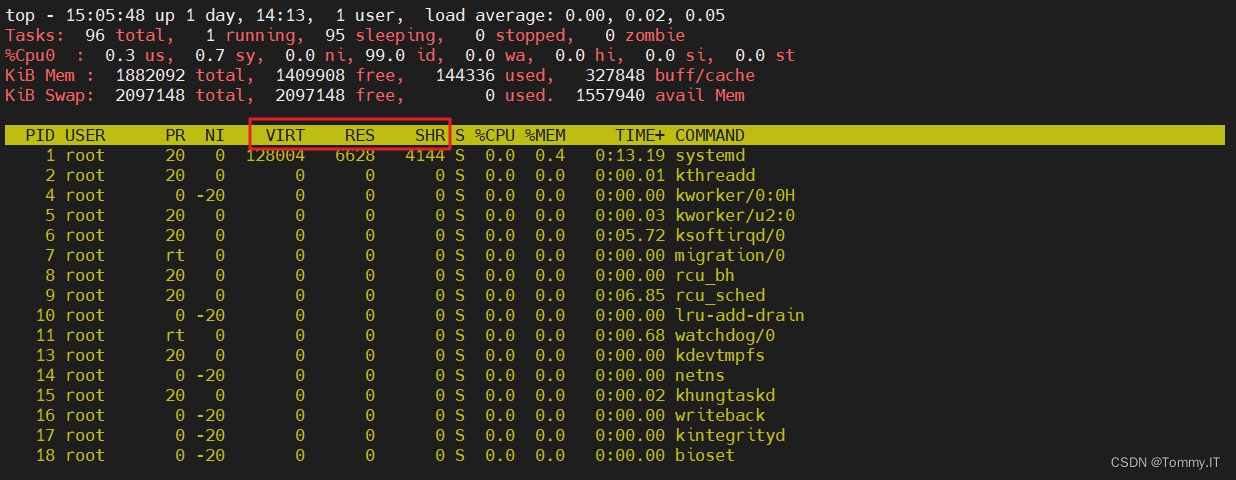
Linux系统top命令中的关于内存的相关单位
VIRT:虚拟内存
RES:真实物理内存
SHR:共享内存
1882092 total,整个内存的大小
1412316 free, 内存上空闲内存大小
143832 used,已使用的内存大小
325944 buff/cache,缓冲缓存
Linux系统中ps命令
- To see every process on the system using standard syntax:
- # 使用标准语法查看系统每个进程
- ps -e
- ps -ef
- ps -eF
- ps -ely
- To see every process on the system using BSD syntax:
- # 使用BSD语法查看系统每个进程
- ps ax
- ps axu
ps -ef | grep java 查询linux系统中的启动的进程,查找包含java关键词的进程
Linux系统中vmstat命令(重点)
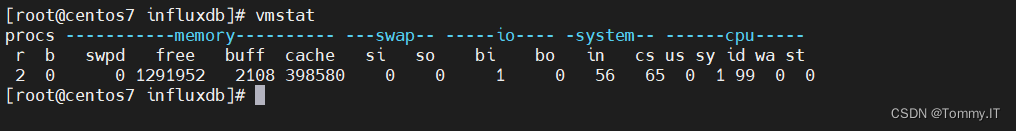
- vmstat
- yum install sysstat -y
- #虚拟内存统计的缩写,可以对虚拟内存、进程、CPU活动进行监控
- [root@centos7 influxdb]# vmstat --help
- Usage:
- vmstat [options] [delay [count]]
- Options:
- -a, --active active(活跃)/inactive(非活跃) memory
- -f, --forks number of forks since boot(从系统启动到现在的fork数量)
- -m, --slabs slabinfo
- -n, --one-header do not redisplay header(头新消息仅显示一次)
- -s, --stats event counter statistics(表格方式显示时间计数器的内存状态)
- -d, --disk disk statistics(磁盘状态)
- -D, --disk-sum summarize disk statistics(指定磁盘分区状态)
- -p, --partition <dev> partition specific statistics
- -S, --unit <char> define display unit(输出信息的定位)
- -w, --wide wide output
- -t, --timestamp show timestamp
- -h, --help display this help and exit
- -V, --version output version information and exit
- For more details see vmstat(8).
vmstat 1 5
虚拟内存统计的缩写,可以对虚拟内存、进程、CPU活动进行监控
vmstat 1 5 # 延迟1秒,执行5次后结束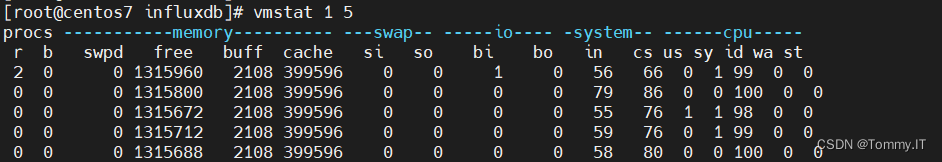
procs 进程相关统计 - r
- b
- 有多少进程等待CPU,等待使用CPU的进程/线程数越多,占用资源越多,CPU资源竞争,说明CPU资源不足
- 有多少进程处于不可中断的休眠,数字越大占用资源越多
memory 内存相关统计 - swpd
- free
- buff
- cache
- 已使用的交换分区(虚拟内存)区大小
- 空闲的内存大小
- 已使用的缓冲区大小
- 已使用的缓存大小
swapd 交换分区相关统计 - si
- so
- 每秒有多少块正在被换入内存(磁盘到内存)
- 每秒有多少块正在被换出到磁盘(内存到磁盘)
io 磁盘读写数据相关统计 - bi
- bo
- 显示多少块从块设备读取
- 显示多少块从块设备写出
system 数字越大系统出现卡顿,响应慢的机会就越高 - in
- cs
- 中断(软中断、硬中断)
- 上下文切换(自愿上下文、非自愿上下文)
cpu - us
- sy
- id
- wa
- st
- us:用户态计算,占用CPU的时间比。(例如:运算简单的加减乘除的时间消耗)
- sy:系统态计算,占用CPU的时间比。(例如:操作打开系统文件动作的时间消耗)
- id:idle CPU空闲时间,占用CPU的时间比。
- wa:CPU等待资源,占用CPU的时间比。(等待,休息)
- hi:hardware interrupt 硬件中断,占用CPU的时间比。
- st:管理CPU任务,占用CPU的时间比。
Linux系统中实时监控CPU的命令mpstat
mpstat安装,需要sysstat工具包集
yum install sysstat -y- EXAMPLES
- mpstat 2 5
- Display five reports of global statistics among all processors at two second intervals.
- mpstat -P ALL 2 5
- Display five reports of statistics for all processors at two second intervals.
- [root@centos7 ~]# mpstat 1 5
- Linux 3.10.0-1127.el7.x86_64 (centos7) 2022年11月12日 _x86_64_ (1 CPU)
- 10时07分53秒 CPU %usr %nice %sys %iowait %irq %soft %steal %guest %gnice %idle
- 10时07分54秒 all 0.00 0.00 0.00 0.00 0.00 0.00 0.00 0.00 0.00 100.00
- 10时07分55秒 all 0.00 0.00 1.00 0.00 0.00 0.00 0.00 0.00 0.00 99.00
- 10时07分56秒 all 0.00 0.00 1.00 0.00 0.00 0.00 0.00 0.00 0.00 99.00
- 10时07分57秒 all 0.00 0.00 0.00 0.00 0.00 0.00 0.00 0.00 0.00 100.00
- 10时07分58秒 all 0.00 0.00 0.00 0.00 0.00 0.00 0.00 0.00 0.00 100.00
- 平均时间: all 0.00 0.00 0.40 0.00 0.00 0.00 0.00 0.00 0.00 99.60
- [root@centos7 ~]# mpstat -P ALL 1 5
- Linux 3.10.0-1127.el7.x86_64 (centos7) 2022年11月12日 _x86_64_ (1 CPU)
- 10时13分32秒 CPU %usr %nice %sys %iowait %irq %soft %steal %guest %gnice %idle
- 10时13分33秒 all 0.00 0.00 0.00 0.00 0.00 0.00 0.00 0.00 0.00 100.00
- 10时13分33秒 0 0.00 0.00 0.00 0.00 0.00 0.00 0.00 0.00 0.00 100.00
- 10时13分33秒 CPU %usr %nice %sys %iowait %irq %soft %steal %guest %gnice %idle
- 10时13分34秒 all 0.00 0.00 1.00 0.00 0.00 0.00 0.00 0.00 0.00 99.00
- 10时13分34秒 0 0.00 0.00 1.00 0.00 0.00 0.00 0.00 0.00 0.00 99.00
- 10时13分34秒 CPU %usr %nice %sys %iowait %irq %soft %steal %guest %gnice %idle
- 10时13分35秒 all 0.98 0.00 0.00 0.00 0.00 0.00 0.00 0.00 0.00 99.02
- 10时13分35秒 0 0.98 0.00 0.00 0.00 0.00 0.00 0.00 0.00 0.00 99.02
- 10时13分35秒 CPU %usr %nice %sys %iowait %irq %soft %steal %guest %gnice %idle
- 10时13分36秒 all 0.00 0.00 0.99 0.00 0.00 0.00 0.00 0.00 0.00 99.01
- 10时13分36秒 0 0.00 0.00 0.99 0.00 0.00 0.00 0.00 0.00 0.00 99.01
- 10时13分36秒 CPU %usr %nice %sys %iowait %irq %soft %steal %guest %gnice %idle
- 10时13分37秒 all 0.00 0.00 0.00 0.00 0.00 0.00 0.00 0.00 0.00 100.00
- 10时13分37秒 0 0.00 0.00 0.00 0.00 0.00 0.00 0.00 0.00 0.00 100.00
- 平均时间: CPU %usr %nice %sys %iowait %irq %soft %steal %guest %gnice %idle
- 平均时间: all 0.20 0.00 0.40 0.00 0.00 0.00 0.00 0.00 0.00 99.40
- 平均时间: 0 0.20 0.00 0.40 0.00 0.00 0.00 0.00 0.00 0.00 99.40
Linux系统中实时监控全部或指定进程的命令pidstat
- EXAMPLES
- pidstat 2 5
- Display five reports of CPU statistics for every active task in the system at two second intervals.
- pidstat -r -p 1643 2 5
- Display five reports of page faults and memory statistics for PID 1643 at two second intervals.
- pidstat -C "fox|bird" -r -p ALL
- Display global page faults and memory statistics for all the processes whose command name includes the string
- "fox" or "bird".
- pidstat -T CHILD -r 2 5
- Display five reports of page faults statistics at two second intervals for the child processes of all tasks in
- the system. Only child processes with non-zero statistics values are displayed.
pidstat -w 1 统计上下文切换
- [root@centos7 ~]# pidstat -w 1
- Linux 3.10.0-1127.el7.x86_64 (centos7) 2022年11月12日 _x86_64_ (1 CPU)
- 10时36分21秒 UID PID cswch/s nvcswch/s Command
- 10时36分22秒 0 1 0.99 0.00 systemd
- 10时36分22秒 0 6 2.97 0.00 ksoftirqd/0
- 10时36分22秒 0 9 17.82 0.00 rcu_sched
- 10时36分22秒 0 11 0.99 0.00 watchdog/0
- 10时36分22秒 0 6955 0.99 0.00 pidstat
- 10时36分22秒 0 6963 0.99 0.00 sleep
- 10时36分22秒 0 9527 10.89 0.00 sshd
- 10时36分22秒 0 9551 6.93 0.00 bash
- 10时36分22秒 0 9598 2.97 0.00 influxd
- 10时36分22秒 0 21348 3.96 0.00 kworker/0:1
PID 进程id cswch/s 每秒自愿上线文切换 nvcswch/s 每秒非自愿上线文切换 pidstat -u 1 5 统计CPU使用情况
- [root@centos7 ~]# pidstat -u 1 5
- Linux 3.10.0-1127.el7.x86_64 (centos7) 2022年11月12日 _x86_64_ (1 CPU)
- 10时47分32秒 UID PID %usr %system %guest %CPU CPU Command
- 10时47分33秒 UID PID %usr %system %guest %CPU CPU Command
- 10时47分34秒 0 12179 0.00 1.00 0.00 1.00 0 pidstat
- 10时47分34秒 UID PID %usr %system %guest %CPU CPU Command
- 10时47分35秒 UID PID %usr %system %guest %CPU CPU Command
- 10时47分36秒 0 9551 1.00 0.00 0.00 1.00 0 bash
- 10时47分36秒 UID PID %usr %system %guest %CPU CPU Command
- 平均时间: UID PID %usr %system %guest %CPU CPU Command
- 平均时间: 0 9551 0.20 0.00 0.00 0.20 - bash
- 平均时间: 0 12179 0.00 0.20 0.00 0.20 - pidstat
Linux系统中查询网络netstat命令
显示与IP/TCP/UDP/ICMP协议的数据统计,用于检测网络连接情况
netstat -anp | grep influx
-a 显示所有连接的socket
-n 显示使用的ip地址,用数字形式展示
-p 显示正在使用socket的程序码和程序名称
-e 显示网络相关信息
-t 显示tcp传输协议的连接状态
netstat 统计某端口连接数
netstat -anp |grep 8088 |wc -l #统计8088端口连接数量
- [root@centos7 ~]# netstat -anp |grep 8088 |wc -l
- 1
netstat 统计某端口某状态连接数
netstat -anp |grep 8088 |grep LISTEN |wc -l #统计8088端口 且状态为LISTEN的连接数量
- [root@centos7 ~]# netstat -anp |grep 8088 |grep LISTEN |wc -l
- 1
Linux系统中查询网络ss命令
- [root@centos7 ~]# ss --help
- Usage: ss [ OPTIONS ]
- ss [ OPTIONS ] [ FILTER ]
- -h, --help this message
- -V, --version output version information
- -n, --numeric don't resolve service names
- -r, --resolve resolve host names
- -a, --all display all sockets
- -l, --listening display listening sockets
- -o, --options show timer information
- -e, --extended show detailed socket information
- -m, --memory show socket memory usage
- -p, --processes show process using socket
- -i, --info show internal TCP information
- -s, --summary show socket usage summary
- -b, --bpf show bpf filter socket information
- -E, --events continually display sockets as they are destroyed
- -Z, --context display process SELinux security contexts
- -z, --contexts display process and socket SELinux security contexts
- -N, --net switch to the specified network namespace name
- -4, --ipv4 display only IP version 4 sockets
- -6, --ipv6 display only IP version 6 sockets
- -0, --packet display PACKET sockets
- -t, --tcp display only TCP sockets
- -S, --sctp display only SCTP sockets
- -u, --udp display only UDP sockets
- -d, --dccp display only DCCP sockets
- -w, --raw display only RAW sockets
- -x, --unix display only Unix domain sockets
- --vsock display only vsock sockets
- -f, --family=FAMILY display sockets of type FAMILY
- FAMILY := {inet|inet6|link|unix|netlink|vsock|help}
- -K, --kill forcibly close sockets, display what was closed
- -H, --no-header Suppress header line
- -A, --query=QUERY, --socket=QUERY
- QUERY := {all|inet|tcp|udp|raw|unix|unix_dgram|unix_stream|unix_seqpacket|packet|netlink|vsock_stream|vsock_dgram}[,QUERY]
- -D, --diag=FILE Dump raw information about TCP sockets to FILE
- -F, --filter=FILE read filter information from FILE
- FILTER := [ state STATE-FILTER ] [ EXPRESSION ]
- STATE-FILTER := {all|connected|synchronized|bucket|big|TCP-STATES}
- TCP-STATES := {established|syn-sent|syn-recv|fin-wait-{1,2}|time-wait|closed|close-wait|last-ack|listen|closing}
- connected := {established|syn-sent|syn-recv|fin-wait-{1,2}|time-wait|close-wait|last-ack|closing}
- synchronized := {established|syn-recv|fin-wait-{1,2}|time-wait|close-wait|last-ack|closing}
- bucket := {syn-recv|time-wait}
- big := {established|syn-sent|fin-wait-{1,2}|closed|close-wait|last-ack|listen|closing}
ss -s 显示网络概况
- [root@centos7 ~]# ss -s
- Total: 182 (kernel 228)
- TCP: 8 (estab 2, closed 0, orphaned 0, synrecv 0, timewait 0/0), ports 0
- Transport Total IP IPv6
- * 228 - -
- RAW 1 0 1
- UDP 3 2 1
- TCP 8 5 3
- INET 12 7 5
- FRAG 0 0 0
Linux系统中查询IO相关信息iostat命令
显示设备、分区和网络文件统计CPU信息换入换出信息
iostat
- [root@centos7 ~]# iostat
- Linux 3.10.0-1127.el7.x86_64 (centos7) 2022年11月12日 _x86_64_ (1 CPU)
- avg-cpu: %user %nice %system %iowait %steal %idle
- 0.27 0.00 0.61 0.01 0.00 99.12
- Device: tps kB_read/s kB_wrtn/s kB_read kB_wrtn
- sda 0.18 0.91 1.28 286949 404027
- dm-0 0.14 0.81 1.28 254859 401828
- dm-1 0.00 0.01 0.00 2204 0
iostat -x #显示扩展信息
avgrq-sz:平均请求大小
avgqu-sz:平均队列长度大小
- [root@centos7 ~]# iostat -x
- Linux 3.10.0-1127.el7.x86_64 (centos7) 2022年11月12日 _x86_64_ (1 CPU)
- avg-cpu: %user %nice %system %iowait %steal %idle
- 0.27 0.00 0.61 0.01 0.00 99.12
- Device: rrqm/s wrqm/s r/s w/s rkB/s wkB/s avgrq-sz avgqu-sz await r_await w_await svctm %util
- sda 0.00 0.01 0.02 0.16 0.91 1.28 23.73 0.00 11.46 0.59 13.07 10.22 0.19
- dm-0 0.00 0.00 0.02 0.13 0.81 1.28 28.90 0.00 14.87 0.72 16.76 13.08 0.19
- dm-1 0.00 0.00 0.00 0.00 0.01 0.00 50.09 0.00 0.08 0.08 0.00 0.07 0.00
iostat -dx 1 5 #显示D磁盘系列信息+扩展信息
- [root@centos7 ~]# iostat -dx 1 5
- Linux 3.10.0-1127.el7.x86_64 (centos7) 2022年11月12日 _x86_64_ (1 CPU)
- Device: rrqm/s wrqm/s r/s w/s rkB/s wkB/s avgrq-sz avgqu-sz await r_await w_await svctm %util
- sda 0.00 0.01 0.02 0.16 0.91 1.28 23.71 0.00 11.46 0.59 13.07 10.22 0.19
- dm-0 0.00 0.00 0.02 0.13 0.81 1.28 28.89 0.00 14.86 0.72 16.75 13.08 0.19
- dm-1 0.00 0.00 0.00 0.00 0.01 0.00 50.09 0.00 0.08 0.08 0.00 0.07 0.00
- Device: rrqm/s wrqm/s r/s w/s rkB/s wkB/s avgrq-sz avgqu-sz await r_await w_await svctm %util
- sda 0.00 0.00 0.00 0.00 0.00 0.00 0.00 0.00 0.00 0.00 0.00 0.00 0.00
- dm-0 0.00 0.00 0.00 0.00 0.00 0.00 0.00 0.00 0.00 0.00 0.00 0.00 0.00
- dm-1 0.00 0.00 0.00 0.00 0.00 0.00 0.00 0.00 0.00 0.00 0.00 0.00 0.00
- Device: rrqm/s wrqm/s r/s w/s rkB/s wkB/s avgrq-sz avgqu-sz await r_await w_await svctm %util
- sda 0.00 0.00 0.00 3.03 0.00 13.13 8.67 0.05 17.00 0.00 17.00 17.00 5.15
- dm-0 0.00 0.00 0.00 2.02 0.00 13.13 13.00 0.05 25.50 0.00 25.50 25.50 5.15
- dm-1 0.00 0.00 0.00 0.00 0.00 0.00 0.00 0.00 0.00 0.00 0.00 0.00 0.00
iostat -dx sda #显示sda第一个磁盘,D系列信息+扩展信息
- [root@centos7 ~]# iostat -dx sda 1 5
- Linux 3.10.0-1127.el7.x86_64 (centos7) 2022年11月12日 _x86_64_ (1 CPU)
- Device: rrqm/s wrqm/s r/s w/s rkB/s wkB/s avgrq-sz avgqu-sz await r_await w_await svctm %util
- sda 0.00 0.01 0.02 0.16 0.91 1.29 23.71 0.00 11.46 0.59 13.07 10.22 0.19
- Device: rrqm/s wrqm/s r/s w/s rkB/s wkB/s avgrq-sz avgqu-sz await r_await w_await svctm %util
- sda 0.00 0.00 0.00 0.00 0.00 0.00 0.00 0.00 0.00 0.00 0.00 0.00 0.00
- Device: rrqm/s wrqm/s r/s w/s rkB/s wkB/s avgrq-sz avgqu-sz await r_await w_await svctm %util
- sda 0.00 0.00 0.00 0.00 0.00 0.00 0.00 0.00 0.00 0.00 0.00 0.00 0.00
- Device: rrqm/s wrqm/s r/s w/s rkB/s wkB/s avgrq-sz avgqu-sz await r_await w_await svctm %util
- sda 0.00 0.00 0.00 0.00 0.00 0.00 0.00 0.00 0.00 0.00 0.00 0.00 0.00
- Device: rrqm/s wrqm/s r/s w/s rkB/s wkB/s avgrq-sz avgqu-sz await r_await w_await svctm %util
- sda 0.00 0.00 0.00 0.00 0.00 0.00 0.00 0.00 0.00 0.00 0.00 0.00 0.00
- EXAMPLES
- iostat
- Display a single history since boot report for all CPU and Devices.
- iostat -d 2
- Display a continuous device report at two second intervals.
- iostat -d 2 6
- Display six reports at two second intervals for all devices.
- iostat -x sda sdb 2 6
- Display six reports of extended statistics at two second intervals for devices sda and sdb.
- iostat -p sda 2 6
- Display six reports at two second intervals for device sda and all its partitions (sda1, etc.)
-c 显示CPU使用率报告
-d 显示设备使用率报告
-k 以每秒千字节显示统计报告
-m 以每秒兆字节显示统计报告
-x 显示扩展信息报告
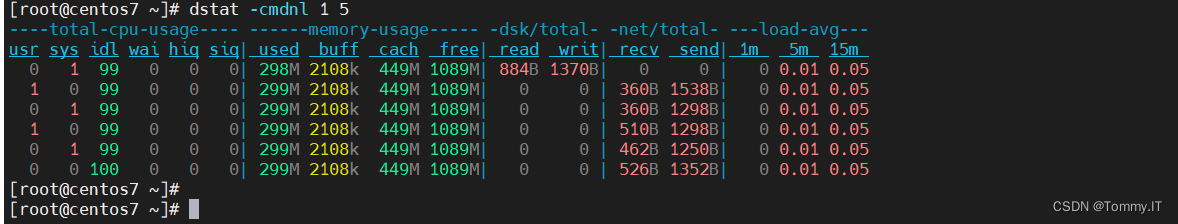
Linux系统综合监控服务器资源dstat命令(重点)
dstat命令安装
yum install dstat -ydstat -cmdnl 1 5
-c 显示CPU信息
-m 显示内存
-d 显示磁盘
-n 显示网络
-l 显示负载
- [root@centos7 ~]# dstat -cmdnl 1 5
- ----total-cpu-usage---- ------memory-usage----- -dsk/total- -net/total- ---load-avg---
- usr sys idl wai hiq siq| used buff cach free| read writ| recv send| 1m 5m 15m
- 0 1 99 0 0 0| 298M 2108k 449M 1089M| 884B 1370B| 0 0 | 0 0.01 0.05
- 1 0 99 0 0 0| 299M 2108k 449M 1089M| 0 0 | 360B 1538B| 0 0.01 0.05
- 0 1 99 0 0 0| 299M 2108k 449M 1089M| 0 0 | 360B 1298B| 0 0.01 0.05
- 1 0 99 0 0 0| 299M 2108k 449M 1089M| 0 0 | 510B 1298B| 0 0.01 0.05
- 0 1 99 0 0 0| 299M 2108k 449M 1089M| 0 0 | 462B 1250B| 0 0.01 0.05
- 0 0 100 0 0 0| 299M 2108k 449M 1089M| 0 0 | 526B 1352B| 0 0.01 0.05
-
相关阅读:
将字符串转换为小写形式字符串.casefold()
LCR 171.训练计划 V
el-autocomplete 必填校验问题
CSAPP 练习题 2.25
解决:vscode和jupyter远程连接无法创建、删除文件的问题(permission denied)
每日一博 - 闲聊 Java 中的中断
前端项目之--提升用户体验,提升前端性能
[C/C++]数据结构 链表OJ题:移除链表元素
T1094 与7无关的数(信息学一本通C++)
Postgresql顺滑升级步骤(11升级到14)
- 原文地址:https://blog.csdn.net/qq_30864373/article/details/127761172
