-
Python动态演示旋转矩阵的作用
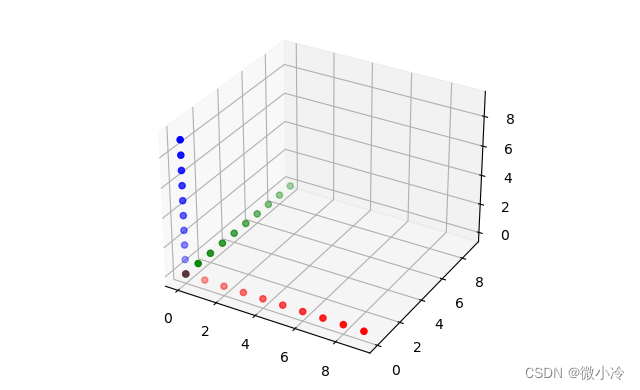
先新建一组散点充当坐标轴
为了比较直观地展示旋转过程,这里通过散点来新建三个坐标轴,通过对这三个坐标轴的转动,来直观地展现转动矩阵对坐标变换的影响。
import numpy as np import matplotlib.pyplot as plt def setAxis(N, axis=0): xs = np.arange(N) ys = np.zeros_like(xs) zs = np.zeros_like(xs) if axis==0 : return [xs, ys, zs] elif axis==1 : return [ys, xs, zs] else: return [ys, zs, xs] def drawAxis(X,Y,Z): ax = plt.subplot(projection='3d') ax.scatter(*X, c='r') ax.scatter(*Y, c='g') ax.scatter(*Z, c='b') plt.show() X = setAxis(10, 0) Y = setAxis(10, 1) Z = setAxis(10, 2) drawAxis(X, Y, Z)- 1
- 2
- 3
- 4
- 5
- 6
- 7
- 8
- 9
- 10
- 11
- 12
- 13
- 14
- 15
- 16
- 17
- 18
- 19
- 20
- 21
- 22
效果为
旋转矩阵与初步演示
欧拉角是用来唯一地确定定点转动刚体位置的三个一组独立角参量,由章动角θ、进动角ψ和自转角φ组成,为L.欧拉首先提出,故得名。
为了尽快进入演示部分,故对原理的介绍从略,仅从二维平面上的旋转矩阵出发,做一个简单的推导,而三维旋转矩阵,至少在形式上与二维是雷同的。
假设坐标系中有一个向量 ( x , y ) (x,y) (x,y),其模长为 r = x 2 + y 2 r=\sqrt{x^2+y^2} r=x2+y2,角度为 θ 0 = arctan y x \theta_0=\arctan\frac{y}{x} θ0=arctanxy。若将其围绕坐标原点逆时针旋转 θ \theta θ,则其坐标变为
x ′ = r cos ( θ 0 + θ ) = r cos θ 0 cos θ − r sin θ 0 sin θ y ′ = r sin ( θ 0 + θ ) = r sin θ 0 cos θ + r cos θ 0 sin θ x' = r\cos(\theta_0+\theta)=r\cos\theta_0\cos\theta-r\sin\theta_0\sin\theta\\ y' = r\sin(\theta_0+\theta)=r\sin\theta_0\cos\theta+r\cos\theta_0\sin\theta x′=rcos(θ0+θ)=rcosθ0cosθ−rsinθ0sinθy′=rsin(θ0+θ)=rsinθ0cosθ+rcosθ0sinθ
由于 x = r cos θ 0 , y = r sin θ 0 x = r\cos\theta_0, y=r\sin\theta_0 x=rcosθ0,y=rsinθ0,则上式可以写为
x ′ = x cos θ − y sin θ y ′ = − x sin θ + y cos θ x'= x\cos\theta - y\sin\theta\\ y'= -x\sin\theta + y\cos\theta x′=xcosθ−ysinθy′=−xsinθ+ycosθ
写成矩阵形式即为
[ x ′ y ′ ] = [ cos θ − sin θ sin θ cos θ ] [ x y ] [x′y′]=[cosθ−sinθsinθcosθ] [xy] [x′y′]=[cosθsinθ−sinθcosθ][xy]
也就是说,在平面直角坐标系上,向量绕原点顺时针旋转 θ \theta θ,相当于左乘一个旋转矩阵。
推广到三维,为了限制 x y xy xy坐标平面上的旋转,要将其旋转中心从原点扩展为绕着 z z z轴旋转,从而三维旋转矩阵可推广为
[ cos θ − sin θ 0 sin θ cos θ 0 0 0 1 ] [cosθ−sinθ0sinθcosθ0001] ⎣ ⎡cosθsinθ0−sinθcosθ0001⎦ ⎤
同理可得到绕三个轴转动的旋转矩阵,为了书写方便,记 S θ = sin θ , C θ = cos θ S_\theta=\sin\theta, C_\theta=\cos\theta Sθ=sinθ,Cθ=cosθ,可列出下表。
R x ( θ ) R_x(\theta) Rx(θ) R x ( θ ) R_x(\theta) Rx(θ) R x ( θ ) R_x(\theta) Rx(θ) [ 1 0 0 0 C θ − S θ 0 S θ C θ ] [1000Cθ−Sθ0SθCθ] ⎣ ⎡1000CθSθ0−SθCθ⎦ ⎤ [ C θ 0 S θ 0 1 0 − S θ 0 C θ ] [Cθ0Sθ010−Sθ0Cθ] ⎣ ⎡Cθ0−Sθ010Sθ0Cθ⎦ ⎤ [ C θ S θ 0 − S θ C θ 0 0 0 1 ] [CθSθ0−SθCθ0001] ⎣ ⎡Cθ−Sθ0SθCθ0001⎦ ⎤ 下面用
lambda表达式来实现,用以描述单个轴的旋转过程。import numpy as np # 将角度转弧度后再求余弦 cos = lambda th : np.cos(np.deg2rad(th)) sin = lambda th : np.sin(np.deg2rad(th)) # 即 Rx(th) => Matrix Rx = lambda th : np.array([ [1, 0, 0], [0, cos(th), -sin(th)], [0, sin(th), cos(th)]]) Ry = lambda th : np.array([ [cos(th), 0, sin(th)], [0 , 1, 0], [-sin(th), 0, cos(th)] ]) Rz = lambda th : np.array([ [cos(th) , sin(th), 0], [-sin(th), cos(th), 0], [0 , 0, 1]])- 1
- 2
- 3
- 4
- 5
- 6
- 7
- 8
- 9
- 10
- 11
- 12
- 13
- 14
- 15
- 16
- 17
- 18
- 19
有了旋转矩阵,就可以旋转,接下来让坐标轴沿着三个轴分别旋转30°,其效果如下
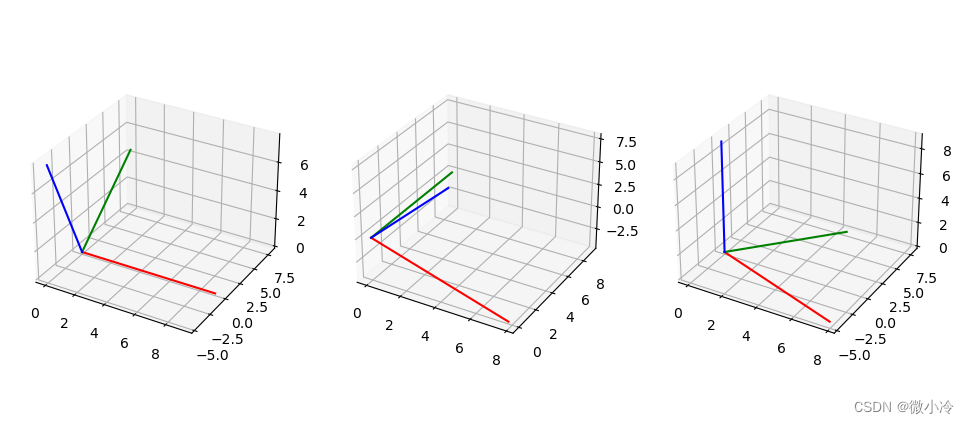
代码如下
def drawAxis(X, Y, Z, fig, i): ax = fig.add_subplot(1,3,i,projection='3d') ax.plot(*X, c='r') ax.plot(*Y, c='g') ax.plot(*Z, c='b') Xx, Yx, Zx = Rx(30) @ X, Rx(30) @ Y, Rx(30) @ Z Xy, Yy, Zy = Ry(30) @ X, Ry(30) @ Y, Ry(30) @ Z Xz, Yz, Zz = Rz(30) @ X, Rz(30) @ Y, Rz(30) @ Z fig = plt.figure("rotate") drawAxis(Xx, Yx, Zx, fig, 1) drawAxis(Xy, Yy, Zy, fig, 2) drawAxis(Xz, Yz, Zz, fig, 3) plt.show()- 1
- 2
- 3
- 4
- 5
- 6
- 7
- 8
- 9
- 10
- 11
- 12
- 13
- 14
- 15
- 16
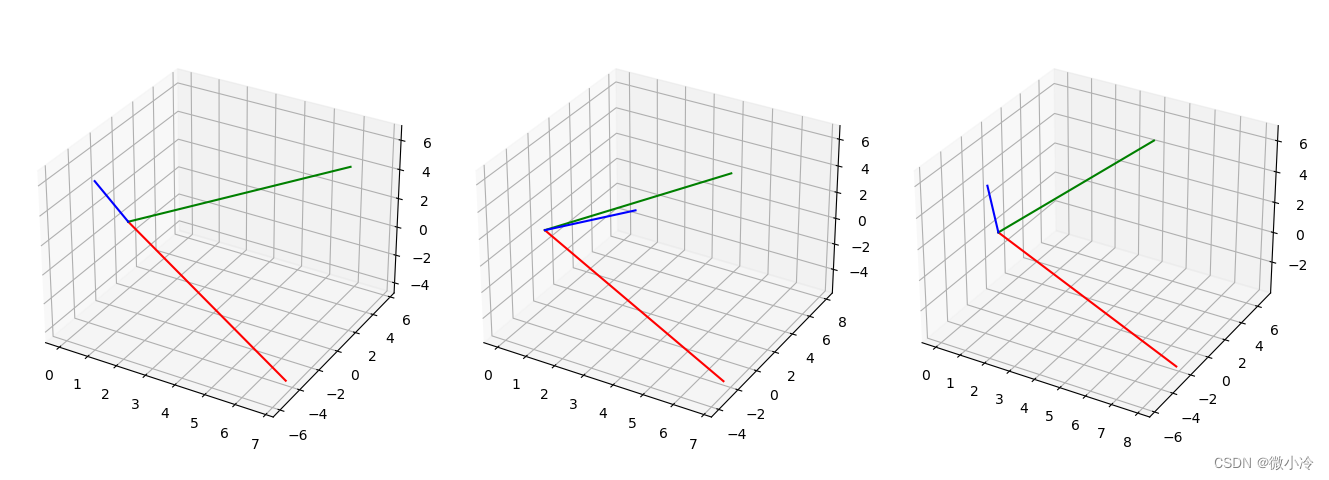
转动次序对旋转的影响
由于旋转被建模成了矩阵,而众所周知矩阵乘法是不可交换的,也就是说,就算绕着三个坐标轴旋转相同的角度,也会因为转动次序不同而引发不同的结果。
XYZ = [X, Y, Z] R_xyz = [Rz(30) @ Ry(30) @ Rx(30) @ R for R in XYZ] R_zyx = [Rx(30) @ Ry(30) @ Rz(30) @ R for R in XYZ] R_yxz = [Rz(30) @ Rx(30) @ Ry(30) @ R for R in XYZ] fig = plt.figure("rotate") drawAxis(*R_xyz, fig, 1) drawAxis(*R_zyx, fig, 2) drawAxis(*R_yxz, fig, 3) plt.show()- 1
- 2
- 3
- 4
- 5
- 6
- 7
- 8
- 9
- 10
- 11
得到下图
动态演示旋转过程
30°的转动之后,坐标轴变得面目全非,接下来要做的就是动态绘制这三个坐标轴的旋转过程
from numpy.random import rand from matplotlib import animation Rot = [Rx, Ry, Rz] # 根据指定坐标轴顺序来以指定角度旋转向量 def rotVec(vec, axis, degs): for i in range(len(axis)): vec = Rot[axis[i]](degs[i]) @ vec return vec # 若x在[a,b]区间,则对a取模,若小于a置0,大于b为b-a def truncMod(x, a, b): if x < a : return 0 elif x >= b : return b-a else : return x%(b-a) # 三个坐标轴 XYZ = [setAxis(10,i) for i in range(3)] fig = plt.figure(figsize=(5,5)) ax = fig.add_subplot(projection='3d') ax.grid() lines = [ax.plot([],[],[], '-', lw=0.5, c=c)[0] for c in 'rgb'] def animate(n): # 按照xyz顺序旋转 axis = [2,1,0] degs = [truncMod(n, st, st + 30) for st in [0,30,60]] newXYZ = [rotVec(x, axis, degs) for x in XYZ] for i in range(3): lines[i].set_data(newXYZ[i][0],newXYZ[i][1]) lines[i].set_3d_properties(newXYZ[i][2]) return lines ani = animation.FuncAnimation(fig, animate, range(90), interval=50, blit=True) #plt.show() ani.save("zyx.gif")- 1
- 2
- 3
- 4
- 5
- 6
- 7
- 8
- 9
- 10
- 11
- 12
- 13
- 14
- 15
- 16
- 17
- 18
- 19
- 20
- 21
- 22
- 23
- 24
- 25
- 26
- 27
- 28
- 29
- 30
- 31
- 32
- 33
- 34
- 35
- 36
- 37
- 38
- 39
- 40
- 41
效果如下
x-y-z z-y-x 

-
相关阅读:
node使用multer进行文件上传
浏览器打印边距,默认/无边距,占满1页A4
手记系列之三 ----- 关于使用Nginx的一些使用方法和经验
【k8s】1、基础概念和架构及组件
web前端期末大作业 基于HTML+CSS+JavaScript程序员个人博客模板(web学生作业源码)
2022 CCF BDCI 返乡发展人群预测 [0.9117+]
论文回顾:Unmixing-Based Soft Color Segmentation for Image Manipulation
3. Visual Studio: Debug within k8s Cluster Using Bridge to Kubernetes
快速查看Oracle数据库告警日志的存储位置
RKMEDIA使用简介
- 原文地址:https://blog.csdn.net/m0_37816922/article/details/127729265
