-
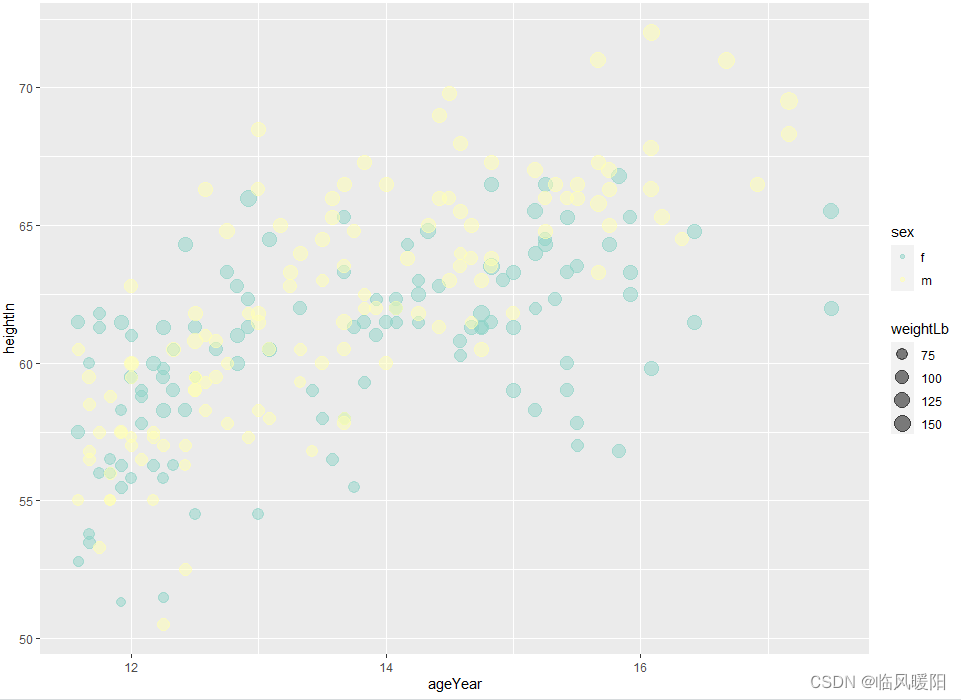
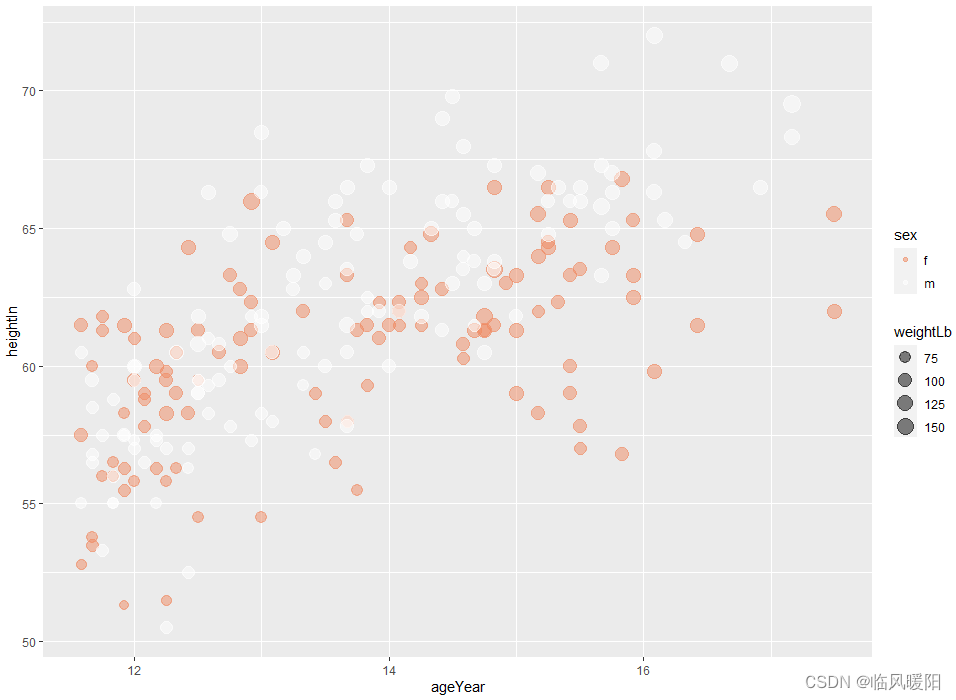
R语言将连续变量映射到颜色或尺寸上二

# List the four columns we'll use ggplot(heightweight, aes(x=ageYear, y=heightIn, size=weightLb, colour=sex)) + geom_point(alpha=.5) + scale_size_area() + # Make area proportional to numeric value scale_colour_brewer(palette="Set1")- 1
- 2
- 3
- 4
- 5
- 6
- 7
- 8

# List the four columns we'll use ggplot(heightweight, aes(x=ageYear, y=heightIn, size=weightLb, colour=sex)) + geom_point(alpha=.5) + scale_size_area() + # Make area proportional to numeric value scale_colour_brewer(palette="Set2")- 1
- 2
- 3
- 4
- 5
- 6
- 7
- 8

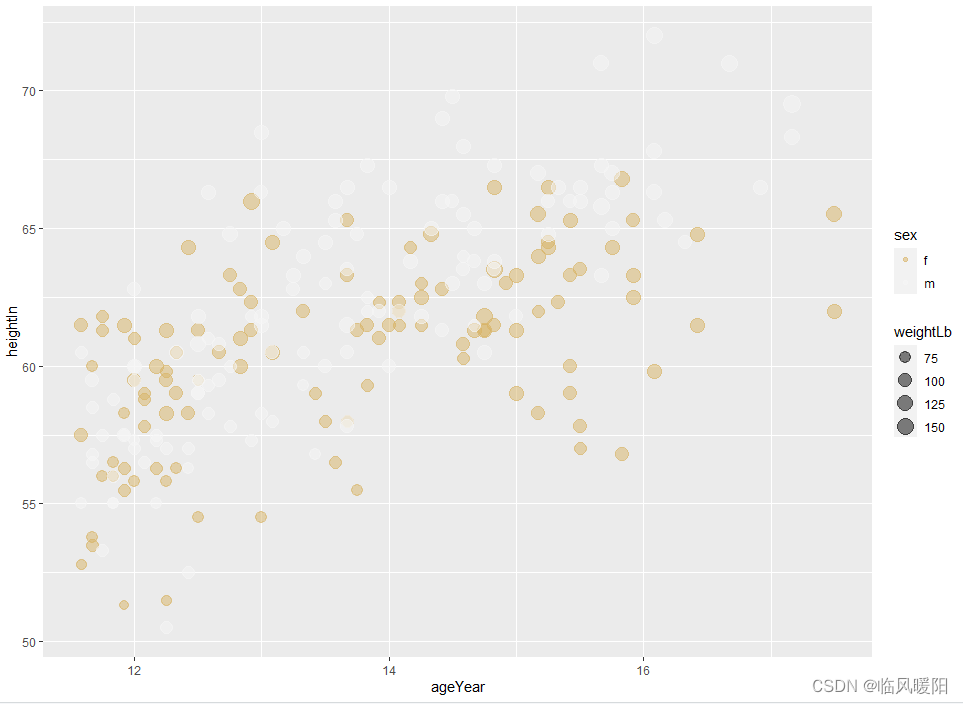
ggplot(heightweight, aes(x=ageYear, y=heightIn, size=weightLb, colour=sex)) + geom_point(alpha=.5) + scale_size_area() + # Make area proportional to numeric value scale_colour_brewer(palette="Set3")- 1
- 2
- 3
- 4
- 5
- 6
- 7
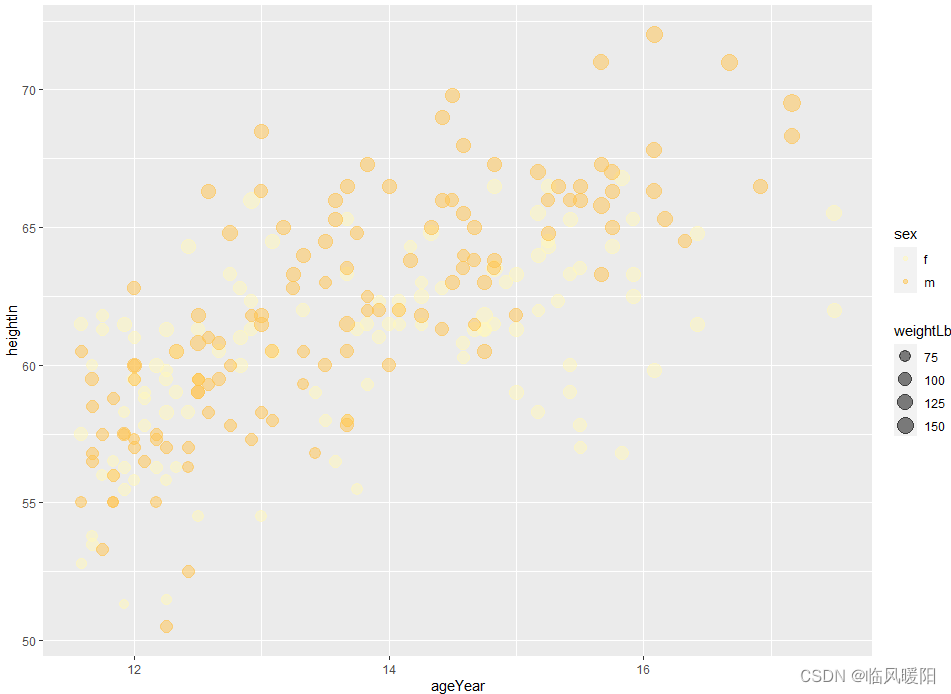
ggplot(heightweight, aes(x=ageYear, y=heightIn, size=weightLb, colour=sex)) + geom_point(alpha=.5) + scale_size_area() + # Make area proportional to numeric value scale_colour_brewer(palette="Pastel2")- 1
- 2
- 3
- 4
- 5
- 6
- 7

# List the four columns we'll use ggplot(heightweight, aes(x=ageYear, y=heightIn, size=weightLb, colour=sex)) + geom_point(alpha=.5) + scale_size_area() + # Make area proportional to numeric value scale_colour_brewer(palette="Pastel1")- 1
- 2
- 3
- 4
- 5
- 6
- 7
- 8

ggplot(heightweight, aes(x=ageYear, y=heightIn, size=weightLb, colour=sex)) + geom_point(alpha=.5) + scale_size_area() + # Make area proportional to numeric value scale_colour_brewer(palette="Paired")- 1
- 2
- 3
- 4
- 5
- 6
- 7

ggplot(heightweight, aes(x=ageYear, y=heightIn, size=weightLb, colour=sex)) + geom_point(alpha=.5) + scale_size_area() + # Make area proportional to numeric value scale_colour_brewer(palette="Accent")- 1
- 2
- 3
- 4
- 5
- 6
- 7

ggplot(heightweight, aes(x=ageYear, y=heightIn, size=weightLb, colour=sex)) + geom_point(alpha=.5) + scale_size_area() + # Make area proportional to numeric value scale_colour_brewer(palette="Spectral")- 1
- 2
- 3
- 4
- 5
- 6
- 7

ggplot(heightweight, aes(x=ageYear, y=heightIn, size=weightLb, colour=sex)) + geom_point(alpha=.5) + scale_size_area() + # Make area proportional to numeric value scale_colour_brewer(palette="PuOr")- 1
- 2
- 3
- 4
- 5
- 6
- 7

ggplot(heightweight, aes(x=ageYear, y=heightIn, size=weightLb, colour=sex)) + geom_point(alpha=.5) + scale_size_area() + # Make area proportional to numeric value scale_colour_brewer(palette="YlOrRd")- 1
- 2
- 3
- 4
- 5
- 6
- 7

ggplot(heightweight, aes(x=ageYear, y=heightIn, size=weightLb, colour=sex)) + geom_point(alpha=.5) + scale_size_area() + # Make area proportional to numeric value scale_colour_brewer(palette="YlOrBr")- 1
- 2
- 3
- 4
- 5
- 6
- 7
ggplot(heightweight, aes(x=ageYear, y=heightIn, size=weightLb, colour=sex)) + geom_point(alpha=.5) + scale_size_area() + # Make area proportional to numeric value scale_colour_brewer(palette="YlGnBu")- 1
- 2
- 3
- 4
- 5
- 6
- 7

ggplot(heightweight, aes(x=ageYear, y=heightIn, size=weightLb, colour=sex)) + geom_point(alpha=.5) + scale_size_area() + # Make area proportional to numeric value scale_colour_brewer(palette="YlGn")- 1
- 2
- 3
- 4
- 5
- 6
- 7

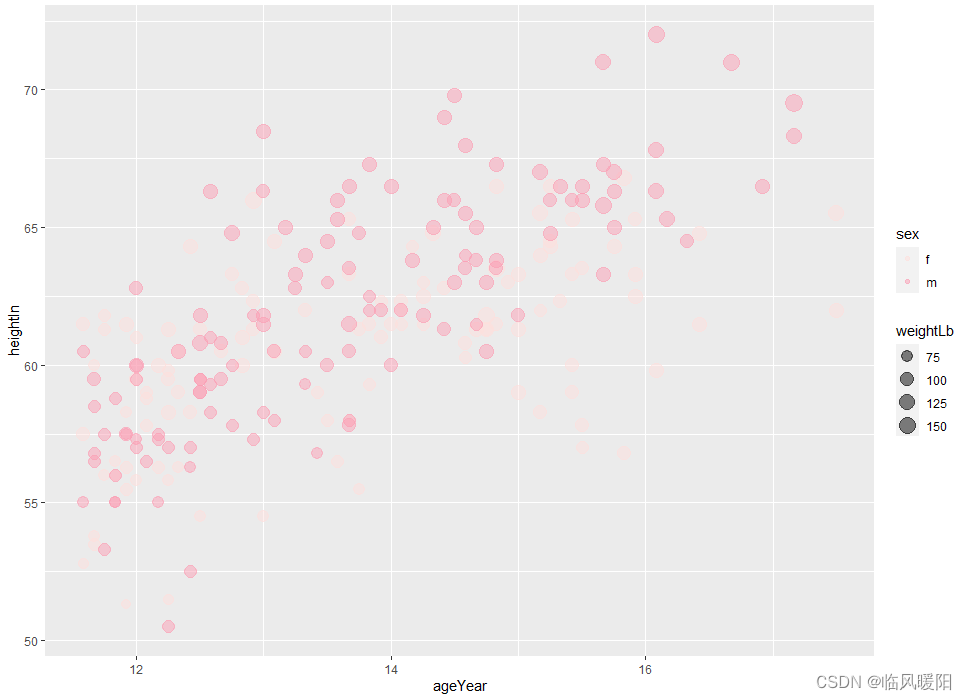
ggplot(heightweight, aes(x=ageYear, y=heightIn, size=weightLb, colour=sex)) + geom_point(alpha=.5) + scale_size_area() + # Make area proportional to numeric value scale_colour_brewer(palette="RdPu")- 1
- 2
- 3
- 4
- 5
- 6
- 7
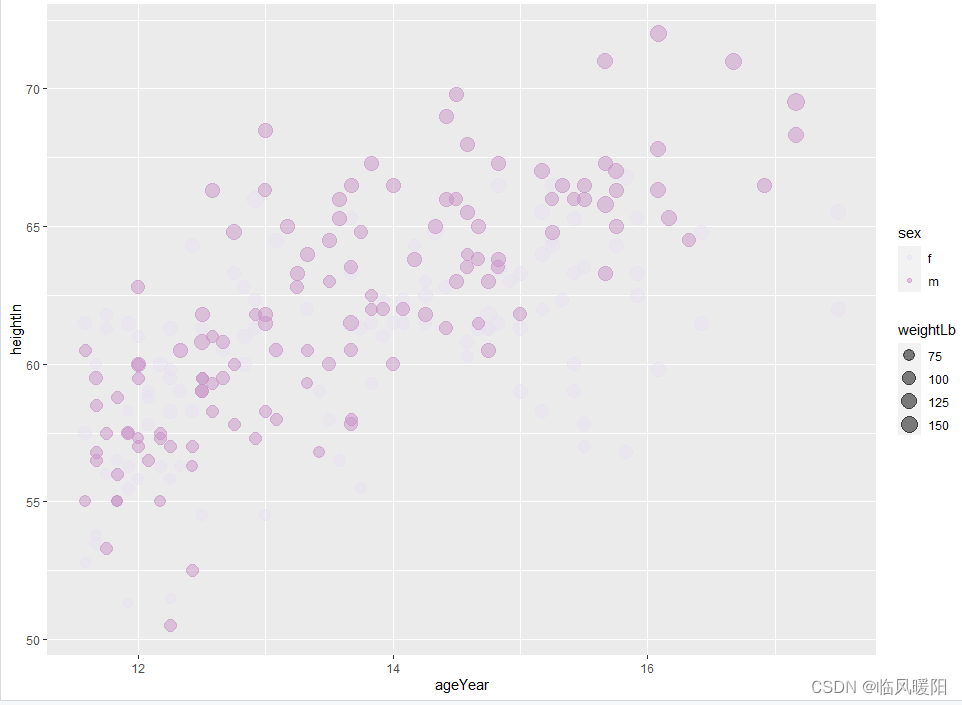
ggplot(heightweight, aes(x=ageYear, y=heightIn, size=weightLb, colour=sex)) + geom_point(alpha=.5) + scale_size_area() + # Make area proportional to numeric value scale_colour_brewer(palette="PuRd")- 1
- 2
- 3
- 4
- 5
- 6
- 7
ggplot(heightweight, aes(x=ageYear, y=heightIn, size=weightLb, colour=sex)) + geom_point(alpha=.5) + scale_size_area() + # Make area proportional to numeric value scale_colour_brewer(palette="RdYlGn")- 1
- 2
- 3
- 4
- 5
- 6
- 7

ggplot(heightweight, aes(x=ageYear, y=heightIn, size=weightLb, colour=sex)) + geom_point(alpha=.5) + scale_size_area() + # Make area proportional to numeric value scale_colour_brewer(palette="RdYlBu")- 1
- 2
- 3
- 4
- 5
- 6
- 7

ggplot(heightweight, aes(x=ageYear, y=heightIn, size=weightLb, colour=sex)) + geom_point(alpha=.5) + scale_size_area() + # Make area proportional to numeric value scale_colour_brewer(palette="RdGy")- 1
- 2
- 3
- 4
- 5
- 6
- 7
ggplot(heightweight, aes(x=ageYear, y=heightIn, size=weightLb, colour=sex)) + geom_point(alpha=.5) + scale_size_area() + # Make area proportional to numeric value scale_colour_brewer(palette="RdBu")- 1
- 2
- 3
- 4
- 5
- 6
- 7

ggplot(heightweight, aes(x=ageYear, y=heightIn, size=weightLb, colour=sex)) + geom_point(alpha=.5) + scale_size_area() + # Make area proportional to numeric value scale_colour_brewer(palette="PuOr")- 1
- 2
- 3
- 4
- 5
- 6
- 7

ggplot(heightweight, aes(x=ageYear, y=heightIn, size=weightLb, colour=sex)) + geom_point(alpha=.5) + scale_size_area() + # Make area proportional to numeric value scale_colour_brewer(palette="PRGn")- 1
- 2
- 3
- 4
- 5
- 6
- 7

# List the four columns we'll use ggplot(heightweight, aes(x=ageYear, y=heightIn, size=weightLb, colour=sex)) + geom_point(alpha=.5) + scale_size_area() + # Make area proportional to numeric value scale_colour_brewer(palette="PiYG")- 1
- 2
- 3
- 4
- 5
- 6
- 7
- 8

ggplot(heightweight, aes(x=ageYear, y=heightIn, size=weightLb, colour=sex)) + geom_point(alpha=.5) + scale_size_area() + # Make area proportional to numeric value scale_colour_brewer(palette="BrBG")- 1
- 2
- 3
- 4
- 5
- 6
- 7
参考文献:Practical Receipes for Visualizing Data----R Graphics Cookbook —Winston Chang O’REILLY
搜狐博客:R语言学习ggplot2之颜色设置,你学会了吗?开发环境:RStudio和微信截屏工具
-
相关阅读:
GET 和 POST请求的区别是什么
CGAL4.4+VC2008编译
Linux aarch64交叉编译之 Google filament引擎
MybatisPlus 4 DML 编程控制 4.3 逻辑删除
【Kubernetes系列】Kubernetes相关概念介绍
7-爬虫-中间件和下载中间件(加代理,加请求头,加cookie)、scrapy集成selenium、源码去重规则(布隆过滤器)、分布式爬虫
Springboot笔记-有header的post请求、get请求
阿里云 腾讯云 配置二级域名并解析指向非80端口操作指南
java-异常
解决 sh 和 bash 在执行脚本时的差异:双括号问题
- 原文地址:https://blog.csdn.net/m0_38127487/article/details/127717417