-
InfluxDB 1.8 性能测试
InfluxDB 1.8 性能测试
测试环境
Intel® Core™ i5-10400CPU @ 2.90GHz
2 核 4 GB
带宽 100Mbit/s
前言
本次基准测试将使用 InfluxData 提供的两款工具进行,写入使用 influx-stress,而读取则使用 influxdb-comparisons。
本次测试准备了两台服务器,一台(192.168.1.2 下面称为客户端)负责生成数据并发送写入请求,另一台(192.168.1.3 下面称为服务机)装有 InfluxDB 1.8 数据的存储。本次主要监测服务机这台服务器的资源占用情况。
工具安装(在客户端安装)
在开始前,先将所需要的工具安装好,你的服务器需要有 docker、go 环境,如果没有可以先将它们安装好。docker 不是必须要安装的(因为它只不过是拿来安装 Netdata 资源监控),这里只说明如何安装 go:
add-apt-repository ppa:longsleep/golang-backports apt-get update apt-get install golang-1.15-go # 如 go 无环境变量,则手动设置 # vim ~/.bashrc # 添加 export PATH=$PATH:/usr/lib/go-1.15/bin # source ~/.bashrc # 设置国内代理(需要 Go 1.13 及以上) go env -w GO111MODULE=on go env -w GOPROXY=https://goproxy.cn,direct- 1
- 2
- 3
- 4
- 5
- 6
- 7
- 8
- 9
- 10
- 11
- 12
服务器资源监控安装
服务器资源监控工具有很多,类似常用的 iostat、vmstat、top 等。
当然也可以使用
Netdata,它提供的 web 界面能够更直观的看到资源的变化,执行以下命令安装:docker run -d --name=netdata \ -p 19999:19999 \ -v /proc:/host/proc:ro \ -v /sys:/host/sys:ro \ -v /var/run/docker.sock:/var/run/docker.sock:ro \ --cap-add SYS_PTRACE \ --security-opt apparmor=unconfined \ netdata/netdata- 1
- 2
- 3
- 4
- 5
- 6
- 7
- 8
完成后访问 192.168.1.2:19999 进入 Web 界面。
安装 influxdb-comparisons
执行以下命令安装
influxdb-comparisons:# 需要 go 语言环境,go version go1.15.9 go get github.com/influxdata/influxdb-comparisons/cmd/bulk_data_gen@latest github.com/influxdata/influxdb-comparisons/cmd/bulk_load_influx@latest go get github.com/influxdata/influxdb-comparisons/cmd/bulk_query_gen@latest github.com/influxdata/influxdb-comparisons/cmd/query_benchmarker_influxdb@latest # 需要将 /root/go/bin 加到环境变量,才能执行 bulk_data_gen、query_benchmarker_influxdb 等命令 # vim ~/.bashrc # 添加 export PATH=$PATH:/root/go/bin # source ~/.bashrc- 1
- 2
- 3
- 4
- 5
- 6
- 7
- 8
- 9
安装 influx-stress
在客户端执行以下命令安装官方版本:
# go 版本 17+ 使用下面命令安装 go install github.com/influxdata/influx-stress/cmd/influx-stress@latest # go 小于 17使用下面命令安装 go get -v github.com/influxdata/influx-stress/cmd/...- 1
- 2
- 3
- 4
- 5
- 6
注意: 上述官网的工具存在bug,当数据写入超过 500W 时会报错,但有大佬修复了该 bug,那么我们本次就使用修复后的 influx-stress(点我下载)。
写入性能测试
我们写入测试使用 influx-stress 进行,当然 influxdb-comparisons 也可以进行写入,但在 InfluxDB 1.8 版本,使用 influx-stress 会更加简单一点。
怎么使用该工具?直接查看
influx-stress的帮助是最简单的方式。[root@c8 ~]# influx-stress insert --help Insert data into InfluxDB Usage: influx-stress insert SERIES FIELDS [flags] Flags: -b, --batch-size uint number of points in a batch (default 10000) -c, --consistency string Write consistency (only applicable to clusters) (default "one") --create string Use a custom create database command --db string Database that will be written to (default "stress") --dump string Dump to given file instead of writing over HTTP -f, --fast Run as fast as possible --gzip int If non-zero, gzip write bodies with given compression level. 1=best speed, 9=best compression, -1=gzip default. --host string Address of InfluxDB instance (default "http://localhost:8086") -k, --kapacitor Use Kapacitor mode, namely do not try to run any queries. --pass string Password for user -n, --points uint number of points that will be written (default 18446744073709551615) --pps uint Points Per Second (default 200000) -p, --precision string Resolution of data being written (default "n") -q, --quiet Only print the write throughput --rp string Retention Policy that will be written to -r, --runtime duration Total time that the test will run (default 2562047h47m16.854775807s) -s, --series int number of series that will be written (default 100000) --stats Record runtime statistics --stats-db string Database that statistics will be written to (default "stress_stats") --stats-host string Address of InfluxDB instance where runtime statistics will be recorded (default "http://localhost:8086") --strict Strict mode will exit as soon as an error or unexpected status is encountered --tick duration Amount of time between request (default 1s) --tls-skip-verify Skip verify in for TLS --user string User to write data as- 1
- 2
- 3
- 4
- 5
- 6
- 7
- 8
- 9
- 10
- 11
- 12
- 13
- 14
- 15
- 16
- 17
- 18
- 19
- 20
- 21
- 22
- 23
- 24
- 25
- 26
- 27
- 28
- 29
- 30
- 31
根据上述说明,可用写出以下命令,意思为总共有 1w 条 points,10000 个 series,每秒写入 10 条 points。
influx-stress insert --host "http://192.168.1.3:8086" --user "root" --pass "123456789" --db "mydb" --points 10000 --pps 10 --series 10000 --fast- 1
influx-stress 写入测试
下表摘自网络的性能评估标准
影响性能因素 好 坏 糟糕 CPU %user + %sys < 70% %user + %sys = 85% %user + %sys >= 90% 磁盘 %iowait < 20% %iowait = 35% %iowait >= 50% 上面的指标,如果用过 top 命令,你应该对他们会有些印象。
%user: 表示 CPU 在用户态的时间占比。
%sys: 表示 CPU 在内核态的时间占比。
%iowait: 表示 CPU 等待输入输出时间的百分比。
测试使用的写入命令如下:(总共写入 6000W 个 points,10000 series)
influx-stress insert --host "http://192.168.1.3:8086" --user "root" --pass "123456789" --db "mydb" --points 60000000 --pps 100000 --series 10000 --fast- 1
下表记录的是不同 pps 的情况:
PPS 写吞吐量 %user %sys %iowait write/s(MB) 1 1000+ 2% 15% 20% 3.5 100,000 176,804 41% 9% 0.00% 0.89 200,000 186,968 46% 12% 0.00% 0.92 300,000 191,961 46% 12% 0.00% 0.99 1000,000 247742 70% 12% 0.00% 3.7 2000,000 257747 85% 12% 0.00% 3 5000,000 报错超时 报错超时 报错超时 报错超时 报错超时 结论:
可用看到,当 pps 为 1 时,写入吞吐量不高,CPU 的使用率也相对不高,但存 io 等待;
当 pps 为 1000,000 时,再增加 pps 吞吐量也不会得到很大的提升;
当 pps 为 5000,000 InfluxDB 直接扛不住,一直报错。
查询性能测试
查询我们使用
influxdb-comparisons进行,步骤是:- 先生成数据到 InfluxDB
- 生成查询的 CURL 语句
- 执行 CURL 语句
influxdb-comparisons 查询测试
数据生成
在测试写入性能之前,不妨在客户端上生成需要写入的数据,执行以下命令:
bulk_data_gen -timestamp-start '2016-09-10T00:00:00Z' \ -timestamp-end '2016-09-10T00:01:00Z' \ -use-case "iot" -scale-var 100000 -sampling-interval 30s \ > iot.txt- 1
- 2
- 3
- 4
以上的命令参数解析(如下了解更多请执行 bulk_data_gen -h):
-
-timestamp-start 生成数据的开始时间(RFC3339 格式)
-
-timestamp-end 生成数据的结束时间(RFC3339 格式)
-
-sampling-interval 模拟数据生成时间间隔,默认 10s
-
-use-case 生成什么类型的数据,默认 devops(choices: devops, iot)
-
-scale-var 在不同案例中特殊变量的个数,例如 iot 中的 home_id 个数,默认 1
-
-format 生成数据的格式,默认 “influx-bulk” (choices: influx-bulk, es-bulk, cassandra, mongo, opentsdb)
执行命令后,生成的数据被输出到 iot.txt
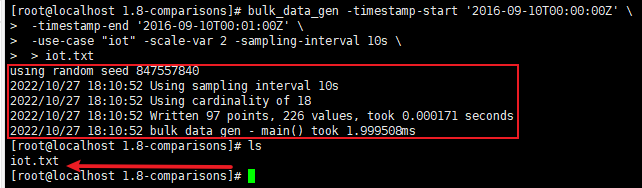
文件里的数据都是符合行协议的,最后一行会有本次生成的数据大小,在执行写入的时候会报错,如果想不报错把它删掉即可

数据写入
需要写入的数据已经存到本地的 iot.txt 中,下面将数据写到服务机的 InfluxDB 中。
在写入之前,我们先执行以下的命令创建一个数据库
mydb# url 的参数 u 表示用户名,p 表示密码 curl -i -XPOST 'http://192.168.1.3:8086/query?u=root&p=123456789' --data-urlencode "q=CREATE DATABASE mydb"- 1
- 2
再执行数据写入
curl -i -XPOST 'http://192.168.1.3:8086/write?db=mydb&u=root&p=123456789' --data-binary @iot.txt- 1
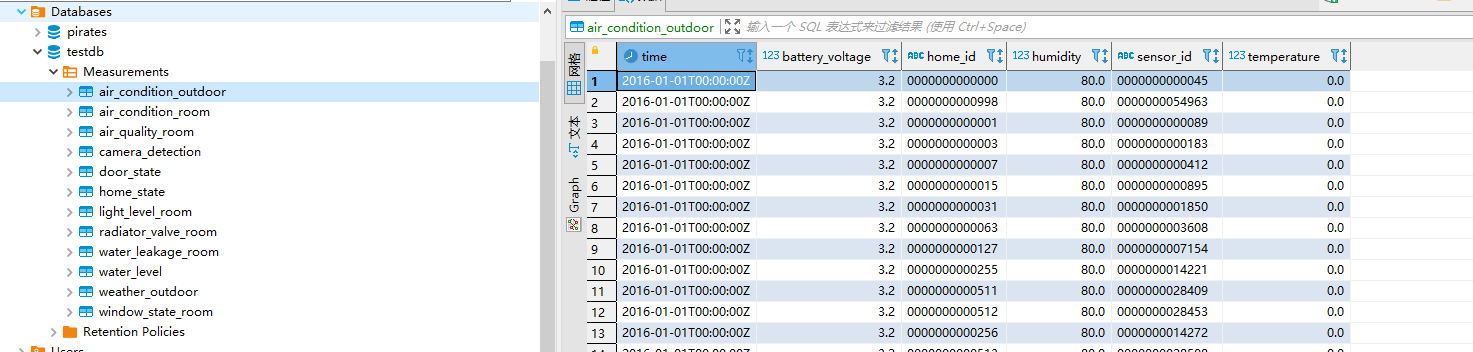
我们使用 dbeaver 连接数据库,可以看到已经成功写入数据
由于 InfluxDB 有 写入 5000 points 的限制,通过 curl 的方式发送文件数量不能过大,必须将文件切分发送

基于该限制,我们可以使用 shell 脚本一条条发送,这样就不用先写了文件,再从文件读取发送请求了
#!/bin/bash total_cnt=0 bulk_data_gen -timestamp-start '2016-01-01T00:00:00Z' -timestamp-end '2016-01-01T00:02:01Z' -use-case "iot" -scale-var 10 -sampling-interval 10s | while read line do curl -i -XPOST 'http://192.168.1.3:8086/write?db=mydb&u=root&p=123456789' --data-binary "$line" total_cnt=`expr $total_cnt + 1` echo "写入第 ${total_cnt} 条记录" done echo "finished." exit 0- 1
- 2
- 3
- 4
- 5
- 6
- 7
- 8
- 9
- 10
如果觉得以上方式很慢,也可以先生成有行协议数据的文件,然后放到服务机使用相应的命令导入。
数据查询
根据上面的脚本,我们生成了 2016-01-01 ~ 2016-01-31 时间范围的数据,大约 126w 条。
由于 influxdb 1.8 在使用
influxdb-comparisons进行查询测试时,并没有找到配置用户密码的方式,因此先到服务机将用户名验证先关闭。[root@c8 influxdb1]# vim /etc/influxdb/influxdb.conf ... [http] enabled = true bind-address = ":8086" # 关闭认证 auth-enabled = false ...- 1
- 2
- 3
- 4
- 5
- 6
- 7
- 8
直接执行以下命令,通过修改不同的参数,即可进行查询的性能测试:
bulk_query_gen -db 'mydb' -queries 10000 -timestamp-start '2016-01-01T00:00:00Z' -timestamp-end '2016-01-31T23:59:59Z' -use-case 'iot' -query-type '1-home-12-hours' -scale-var 1000 | query_benchmarker_influxdb -urls 'http://192.168.1.3:8086' -workers 2 -limit 2000- 1
命令解析:
先通过 bulk_query_gen 生成数据库名为 mydb,数据范围从 2016-01-01 到 2016-01-31 的 iot 查询,然后通过 query_benchmarker_influxdb 使用刚生成的查询进行基准测试(更多参数请添加 -h 自行查看)。
查询命令执行次数 (-limit) 总耗时 CPU占用 并发数 100 0.050640sec 1.0% 2 500 0.261805sec 3.3% 2 1000 0.457490sec 11.6% 2 5000 2.417536sec 36.2% 2 10000 5.312676sec 77% 2 50000 4.947845sec 84% 2 100000 5.309665se 85% 2 1000 0.342996sec 20% 5 5000 1.633290sec 71% 5 10000 2.507805sec 131% 5 结论
可以看到当并发数为 2 (服务机 CPU 核数)时,查询 1w、5w、10w limit 时的 CPU 波动不会太大,基本维持在 70 ~ 85% 的范围内。
当并发数为 5 且 limit 为 1w 时 CPU 已经被打满,该值与官网的硬件指导基本一致。

总结
本文使用 influx-stress 与 influxdb-comparisons 对 InfluxDB1.8 进行了基准测试,其中 influx-stress 主要用于写入的性能测试,influxdb-comparisons 用于查询的性能测试。从测试的结果看,InfluxDB 对于写入的性能是非常高的,甚至硬件好的话单点就能达到百万级的吞吐量,但对于高并发的查询就很容易导致 CPU 被打满。
-
相关阅读:
RESTFul风格接口如何设计
【Redis】事务、lua脚本、发布订阅、异步连接
springboot基于web的传染病信息管理系统的设计与实现毕业设计-附源码221124
彩虹易支付 9.27 最新版加订单查询 sy 更新版
Docker Compose映射卷的作用是什么,dockerfile这个文件有什么区别和联系?
Java很简单的文件上传(transferTo方式)
2023国家工业软件大会:科东软件与您共创智能时代,引领产业变革!
5分钟学会 gRPC
Java 框架的一些文件配置
socket编程之常用api介绍与socket、select、poll、epoll高并发服务器模型代码实现
- 原文地址:https://blog.csdn.net/qq_39363204/article/details/127629933
