-
Matplotlib | 世界足球俱乐部排名可视化
大家好,我是 👉【Python当打之年(点击跳转)】
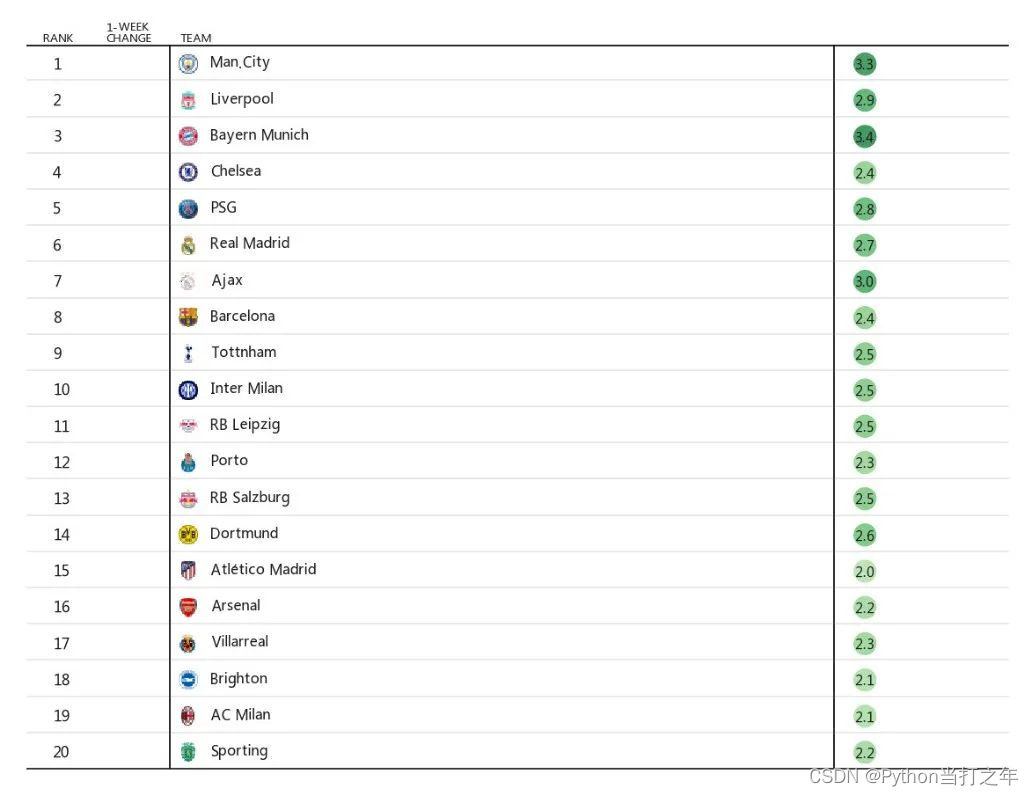
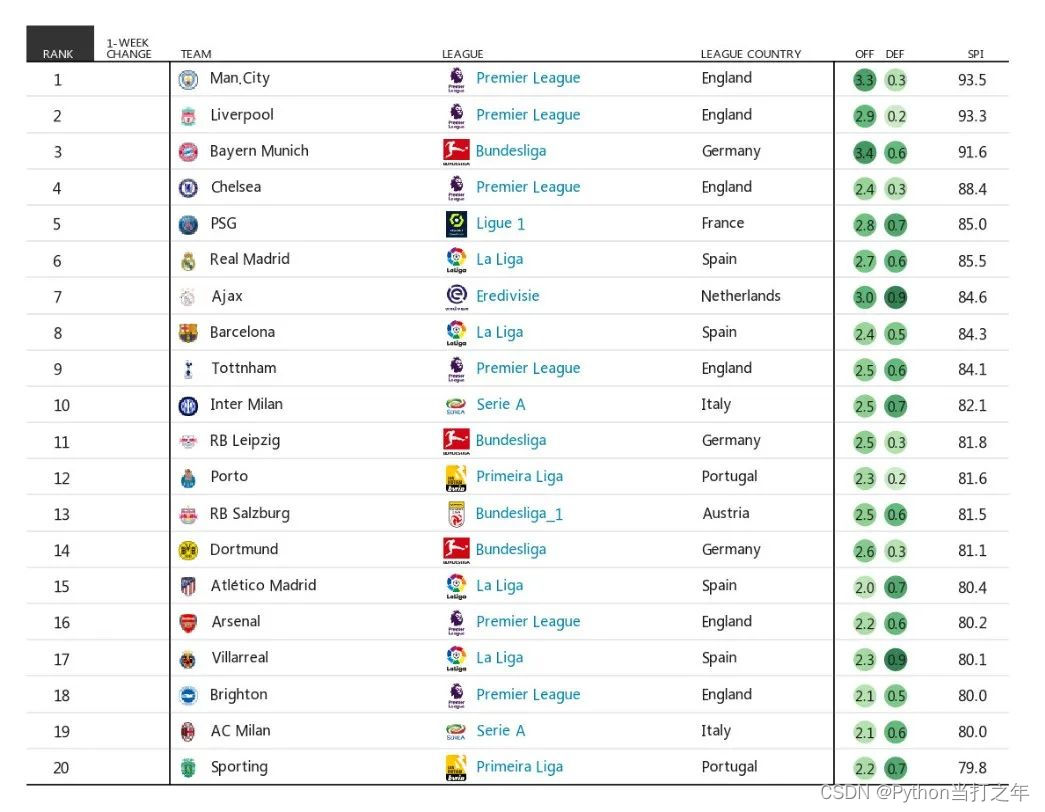
本期我们参考FiveThirtyEight发布的世界足球俱乐部排名,
利用Matplotlib手把手教大家如何制作新闻级别可视化作品,希望对小伙伴们有所帮助,如有疑问或者需要改进的地方可以私信小编。先看看效果:

🏳️🌈 1. 导入模块
import matplotlib.pyplot as plt import matplotlib.patches as patches import matplotlib.image as mpimg from matplotlib.offsetbox import OffsetImage, AnnotationBbox- 1
- 2
- 3
- 4
🏳️🌈 2. 示例数据
dic_t = {'Premier League':'England','Bundesliga':'Germany','Ligue 1':'France', 'La Liga':'Spain', 'Eredivisie':'Netherlands','Serie A':'Italy', 'Primeira Liga':'Portugal','Bundesliga_1':'Austria'} team = ['Man.City', 'Liverpool', 'Bayern Munich', 'Chelsea', 'PSG', 'Real Madrid', 'Ajax', 'Barcelona', 'Tottnham', 'Inter Milan', 'RB Leipzig', 'Porto', 'RB Salzburg', 'Dortmund', 'Atlético Madrid', 'Arsenal', 'Villarreal', 'Brighton', 'AC Milan', 'Sporting'][::-1] league = ['Premier League', 'Premier League', 'Bundesliga', 'Premier League', 'Ligue 1', 'La Liga', 'Eredivisie', 'La Liga', 'Premier League', 'Serie A', 'Bundesliga', 'Primeira Liga', 'Bundesliga_1', 'Bundesliga', 'La Liga', 'Premier League', 'La Liga', 'Premier League', 'Serie A', 'Primeira Liga'][::-1] league_country = [dic_t[i] for i in league] rank = [1, 2, 3, 4, 5, 6, 7, 8, 9, 10, 11, 12, 13, 14, 15, 16, 17, 18, 19, 20][::-1] OFF = [3.3,2.9,3.4,2.4,2.8,2.7,3.0,2.4,2.5,2.5, 2.5,2.3,2.5,2.6,2.0,2.2,2.3,2.1,2.1,2.2][::-1] DEF = [0.3,0.2,0.6,0.3,0.7,0.6,0.9,0.5,0.6,0.7, 0.3,0.2,0.6,0.3,0.7,0.6,0.9,0.5,0.6,0.7][::-1] SPI = [93.5,93.3,91.6,88.4,85.0,85.5,84.6,84.3,84.1,82.1, 81.8,81.6,81.5,81.1,80.4,80.2,80.1,80.0,80.0,79.8][::-1]- 1
- 2
- 3
- 4
- 5
- 6
- 7
- 8
- 9
- 10
- 11
- 12
- 13
- 14
- 15
🏳️🌈 3. 画布设置
fig, ax = plt.subplots(1, 1, dpi=300) # 隐藏y轴 ax.get_yaxis().set_visible(False) ax.get_xaxis().set_visible(False) # 将刻度小横线设置为白色,标签颜色为黑色 plt.tick_params(axis='x', color='w') # x,y轴刻度范围 ax.set_xlim(0, 2) # ax.set_xticks(range(0, 10, 1)) ax.set_ylim(0, 4)- 1
- 2
- 3
- 4
- 5
- 6
- 7
- 8
- 9
- 10
🏳️🌈 4. 画布区域主题分配
# 设置上下左右外框变为透明 for i in ['top', 'right', 'left', 'bottom']: ax.spines[i].set_visible(False) title_size = 3.2 title_pos = 40 ax.axhline(y=title_pos, xmax=.8, c='black', lw=0.4) ax.axvline(x=.7, ymin=0.002, ymax=.909, c='black', lw=0.4) ax.axvline(x=3.95, ymin=0.002, ymax=.909, c='black', lw=0.4) ax.axhline(y=0.1, xmax=.8, c='black', lw=0.4)- 1
- 2
- 3
- 4
- 5
- 6
- 7
- 8
- 9

🏳️🌈 5. 添加数据散点
x1 = [4.1] * len(rank) y1 = [1 + i * 2 for i in range(len(rank))] ax.scatter(x1, y1, s=40,alpha=0.8)- 1
- 2
- 3

🏳️🌈 6. 添加表头
ax.text(0.08, 0.2 + title_pos, 'RANK', fontdict={'color': '#1C1C1C', 'size': title_size}, fontweight='bold') ax.text(0.39, 0.2 + title_pos, '1-WEEK\nCHANGE', fontdict={'color': '#1C1C1C', 'size': title_size}, fontweight='heavy') ax.text(0.75, 0.2 + title_pos, 'TEAM', fontdict={'color': '#1C1C1C', 'size': title_size}, fontweight='heavy')- 1
- 2
- 3

🏳️🌈 7. 添加数据
for i in range(len(rank)): ax.axhline(y=0.1 + i * 2, xmax=.8, c='gray', lw=0.4, alpha=0.2) ax.text(0.13, 0.78 + i * 2, str(rank[i]), fontdict={'color': '#1C1C1C', 'size': 4}, fontweight='normal') ax.text(.75, 0.78 + i * 2, str(team[i]), fontdict={'color': '#1C1C1C', 'size': 4}, fontweight='heavy') ax.text(4.05, 0.75 + i * 2, str(OFF[i]), fontdict={'color': '#1C1C1C', 'size': 3.6}, fontweight='normal')- 1
- 2
- 3
- 4
- 5
- 6

🏳️🌈 8. 设置colarbar
x1 = [4.1] * len(rank) y1 = [1 + i * 2 for i in range(len(rank))] ax.scatter(x1, y1, c=OFF, s=40, cmap='Greens', alpha=0.8)- 1
- 2
- 3

🏳️🌈 9. 添加俱乐部flag
🏳️🌈 10. 添加其他数据
🏳️🌈 11. 添加标题、注释

🏳️🌈 12. 在线运行地址
在线运行地址(含全部代码):
https://www.heywhale.com/mw/project/6358ffe4d9319f9326104897
文章首发:微信公众号 “Python当打之年” ,Python编程技巧推送,希望大家可以喜欢。
以上就是本期为大家整理的全部内容了,赶快练习起来吧,原创不易,喜欢的朋友可以点赞、收藏也可以分享(注明出处)让更多人知道。
推荐阅读
- ⚽ 【Matplotlib | 世界足球俱乐部排名可视化】
- 🏭 【Pandas+Pyecharts | 2022年世界500强数据分析可视化】
- 📲 【Pandas+Pyecharts | 快手APP大学生用户数据分析可视化】
- 🥤 【Pandas+Pyecharts | 上海市餐饮数据分析可视化】
- 👨🎓 【Pandas+Pyecharts | 山东省高考考生数据分析可视化】
- 🚗 【Pandas+Pyecharts | 40000+汽车之家数据分析可视化】
- 🛒 【Pandas+Pyecharts | 20000+天猫订单数据可视化】
- 🏠 【Pandas+Pyecharts | 广州市已成交房源信息数据可视化】
- 🏫 【Pandas+Pyecharts | 考研信息数据可视化】
- 💸 【Pandas+Pyecharts | 某平台招聘信息数据可视化】
- 🏥 【Pandas+Pyecharts | 医院药品销售数据可视化】
- 💰️ 【Pyecharts | 比特币每日价格动态可视化】
- 🥮 【可视化 | Python中秋月饼销量分析,这些口味才是yyds!】
- 🎦 【Pyecharts | 《白蛇2:青蛇劫起》20000+数据分析可视化】
- 💑 【Pyecharts | 历年全国各地民政局登记数据分析+可视化】
- 🌏 【Pandas+Pyecharts | 全国热门旅游景点数据分析+可视化】
- 🏆 【Pandas+Pyecharts | 2020东京奥运会奖牌数据可视化】
- 🏹 【Pandas常用基础操作指令汇总 】
- 🎯 【pandas + pyecharts | ADX游戏广告投放渠道综合分析】
- 🕔 【Schedule + Pyecharts | 时间序列图(动态轮播图)】
- 🏠 【Pandas+Pyecharts | 北京某平台二手房数据分析+可视化】
- 🏫 【Pandas+Pyecharts | 2021中国大学综合排名分析+可视化】
- 🎦 【爬虫 | Python爬取豆瓣电影Top250 + 数据可视化】
- 📡 【技巧 | Python创建自己的高匿代理IP池】
-
相关阅读:
[Python学习篇] Python列表
如何给视频加水印标记?分享三个好用方法给你
传输安全HTTPS
容器服务ACK是什么
swagger接口导入到数据库实现
appium+python自动化测试
DGL学习笔记——第一章 图
人工智能第2版学习——产生式系统2
Linux系统编程系列之线程的信号处理
算法分析——大O标记法
- 原文地址:https://blog.csdn.net/weixin_42152811/article/details/127547064