-
Prometheus----3
Prometheus----3
Prometheus(135)
环境准备工作
服务器类型 IP地址 组件 Prometheus服务器 192.168.116.134 Prometheus、node_exporter grafana服务器 192.168.116.136 Grafana agent服务器 192.168.116.135 node_exporter Prometheus的部署
cd /opt 上传prometheus-2.37.1.linux-amd64.tar.gz到/opt目录中,并解压 tar xf prometheus-2.37.0.linux-amd64.tar.gz mv prometheus-2.37.0.linux-amd64 /usr/local/prometheus cd /usr/local/prometheus vim prometheus.yml- 1
- 2
- 3
- 4
- 5
- 6
- 7
- 8
![[外链图片转存失败,源站可能有防盗链机制,建议将图片保存下来直接上传(img-npQ0A4Ga-1666860016699)(F:\typorase\jpg\981.png)]](https://1000bd.com/contentImg/2024/05/23/65e4f888f535d6fa.png)
配置系统启动文件,设置开机自启
vim /usr/lib/systemd/system/prometheus.service [Unit] Description=Prometheus Server Documentation=https://prometheus.io After=network.target [Service] Type=simple ExecStart=/usr/local/prometheus/prometheus \ --config.file=/usr/local/prometheus/prometheus.yml \ --storage.tsdb.path=/usr/local/prometheus/data/ \ --storage.tsdb.retention=15d \ --web.enable-lifecycle ExecReload=/bin/kill -HUP $MAINPID Restart=on-failure [Install] WantedBy=multi-user.target- 1
- 2
- 3
- 4
- 5
- 6
- 7
- 8
- 9
- 10
- 11
- 12
- 13
- 14
- 15
- 16
- 17
- 18
- 19
- 20
- 21
![[外链图片转存失败,源站可能有防盗链机制,建议将图片保存下来直接上传(img-AcRvrfoh-1666860016700)(F:\typorase\jpg\982.png)]](https://1000bd.com/contentImg/2024/05/23/75b8ec347bbb96bb.png)
开启prometheus,并访问网页验证
systemctl start prometheus systemctl enable prometheus netstat -natp | grep :9090 浏览器访问:http://192.168.223.30:9090 ,访问到 Prometheus 的 Web UI 界面 点击页面的 Status -> Targets,如看到 Target 状态都为 UP,说明 Prometheus 能正常采集到数据 http://192.168.223.30:9090/metrics ,可以看到 Prometheus 采集到自己的指标数据- 1
- 2
- 3
- 4
- 5
- 6
- 7
- 8
通过浏览器访问 http:// 服务器 IP:9090 就可以访问到 Prometheus 的主界面:
![[外链图片转存失败,源站可能有防盗链机制,建议将图片保存下来直接上传(img-xTJdHYjU-1666860016700)(F:\typorase\jpg\983.png)]](https://1000bd.com/contentImg/2024/05/23/bad063642148553d.png)
默认只监控了本机一台,点 Status→点 Targets→可以看到只监控了本机:
![[外链图片转存失败,源站可能有防盗链机制,建议将图片保存下来直接上传(img-IRSBvBo8-1666860016700)(F:\typorase\jpg\984.png)]](https://1000bd.com/contentImg/2024/05/23/fbca53963a87e528.png)
通过 http:// 服务器 IP:9090/metrics 可以查看到监控的数据:
![[外链图片转存失败,源站可能有防盗链机制,建议将图片保存下来直接上传(img-9F7Hvb32-1666860016700)(F:\typorase\jpg\985.png)]](https://1000bd.com/contentImg/2024/05/23/780b3a354919ba64.png)
部署Exporters(135)
监控远程Linux主机(135)
在远程 linux 主机(被监控端 agent)上安装 node_exporter 组件
cd /opt/ tar xf node_exporter-1.3.1.linux-amd64.tar.gz mv node_exporter-1.3.1.linux-amd64/node_exporter /usr/local/bin- 1
- 2
- 3
![[外链图片转存失败,源站可能有防盗链机制,建议将图片保存下来直接上传(img-pvpAcn6X-1666860016701)(F:\typorase\jpg\986.png)]](https://1000bd.com/contentImg/2024/05/23/a147ab91a9772dfb.png)
配置启动文件,设置开机自启
vim /usr/lib/systemd/system/node_exporter.service [Unit] Description=node_exporter Documentation=https://prometheus.io/ After=network.target [Service] Type=simple ExecStart=/usr/local/bin/node_exporter \ --collector.ntp \ --collector.mountstats \ --collector.systemd \ --collector.tcpstat ExecReload=/bin/kill -HUP $MAINPID Restart=on-failure [Install] WantedBy=multi-user.target- 1
- 2
- 3
- 4
- 5
- 6
- 7
- 8
- 9
- 10
- 11
- 12
- 13
- 14
- 15
- 16
- 17
- 18
- 19
![[外链图片转存失败,源站可能有防盗链机制,建议将图片保存下来直接上传(img-RQJvyECO-1666860016701)(F:\typorase\jpg\987.png)]](https://1000bd.com/contentImg/2024/05/23/dd99c0195fdb0823.png)
启动node_exporter
systemctl start node_exporter systemctl enable node_exporter netstat -natp | grep :9100 浏览器访问:http://192.168.116.135:9100/metrics ,可以看到 Node Exporter 采集到的指标数据- 1
- 2
- 3
- 4
- 5
- 6
![[外链图片转存失败,源站可能有防盗链机制,建议将图片保存下来直接上传(img-589XSj0t-1666860016701)(F:\typorase\jpg\988.png)]](https://1000bd.com/contentImg/2024/05/23/8ecf4ea096cef9d9.png)
修改Prometheus服务器的配置文件
回到 Prometheus 服务器的配置文件里添加被监控机器的配置段
vim /usr/local/prometheus/prometheus.yml - job_name: 'agent' static_configs: - targets: ['192.168.116.135:9100']- 1
- 2
- 3
- 4
![[外链图片转存失败,源站可能有防盗链机制,建议将图片保存下来直接上传(img-lqIW7DJp-1666860016701)(F:\typorase\jpg\989.png)]](https://1000bd.com/contentImg/2024/05/23/2ed347f08446de90.png)
改完配置文件后,重启服务
![[外链图片转存失败,源站可能有防盗链机制,建议将图片保存下来直接上传(img-gqnHWaLw-1666860016702)(F:\typorase\jpg\990.png)]](https://1000bd.com/contentImg/2024/05/23/b96567f63bc14fd6.png)
访问prometheus服务器
回到 web 管理界面→点 Status→点 Targets→可以看到多了一台监控目标
![[外链图片转存失败,源站可能有防盗链机制,建议将图片保存下来直接上传(img-QFLyYlJK-1666860016702)(F:\typorase\jpg\991.png)]](https://1000bd.com/contentImg/2024/05/23/9ea8094e09493acf.png)
注:也可以在本机安装 node_exporter,使用上面的方式监控本机
部署Grafana进行展示
Grafana 是一个开源的度量分析和可视化工具,可以通过将采集的数据分析,查询,然后进行可视化的展示,并能实现报警
下载安装Grafana(136)
#使用yum解决依赖关系 我这边直接上传软件包到opt yum install -y grafana-7.4.0-1.x86_64.rpm 或 rpm -ivh /opt/grafana-7.3.6-1.x86_64.rpm systemctl start grafana-server systemctl enable grafana-server netstat -natp | grep :3000 浏览器访问:http://192.168.116.136:3000 ,默认账号和密码为 admin/admin- 1
- 2
- 3
- 4
- 5
- 6
- 7
- 8
- 9
- 10
- 11
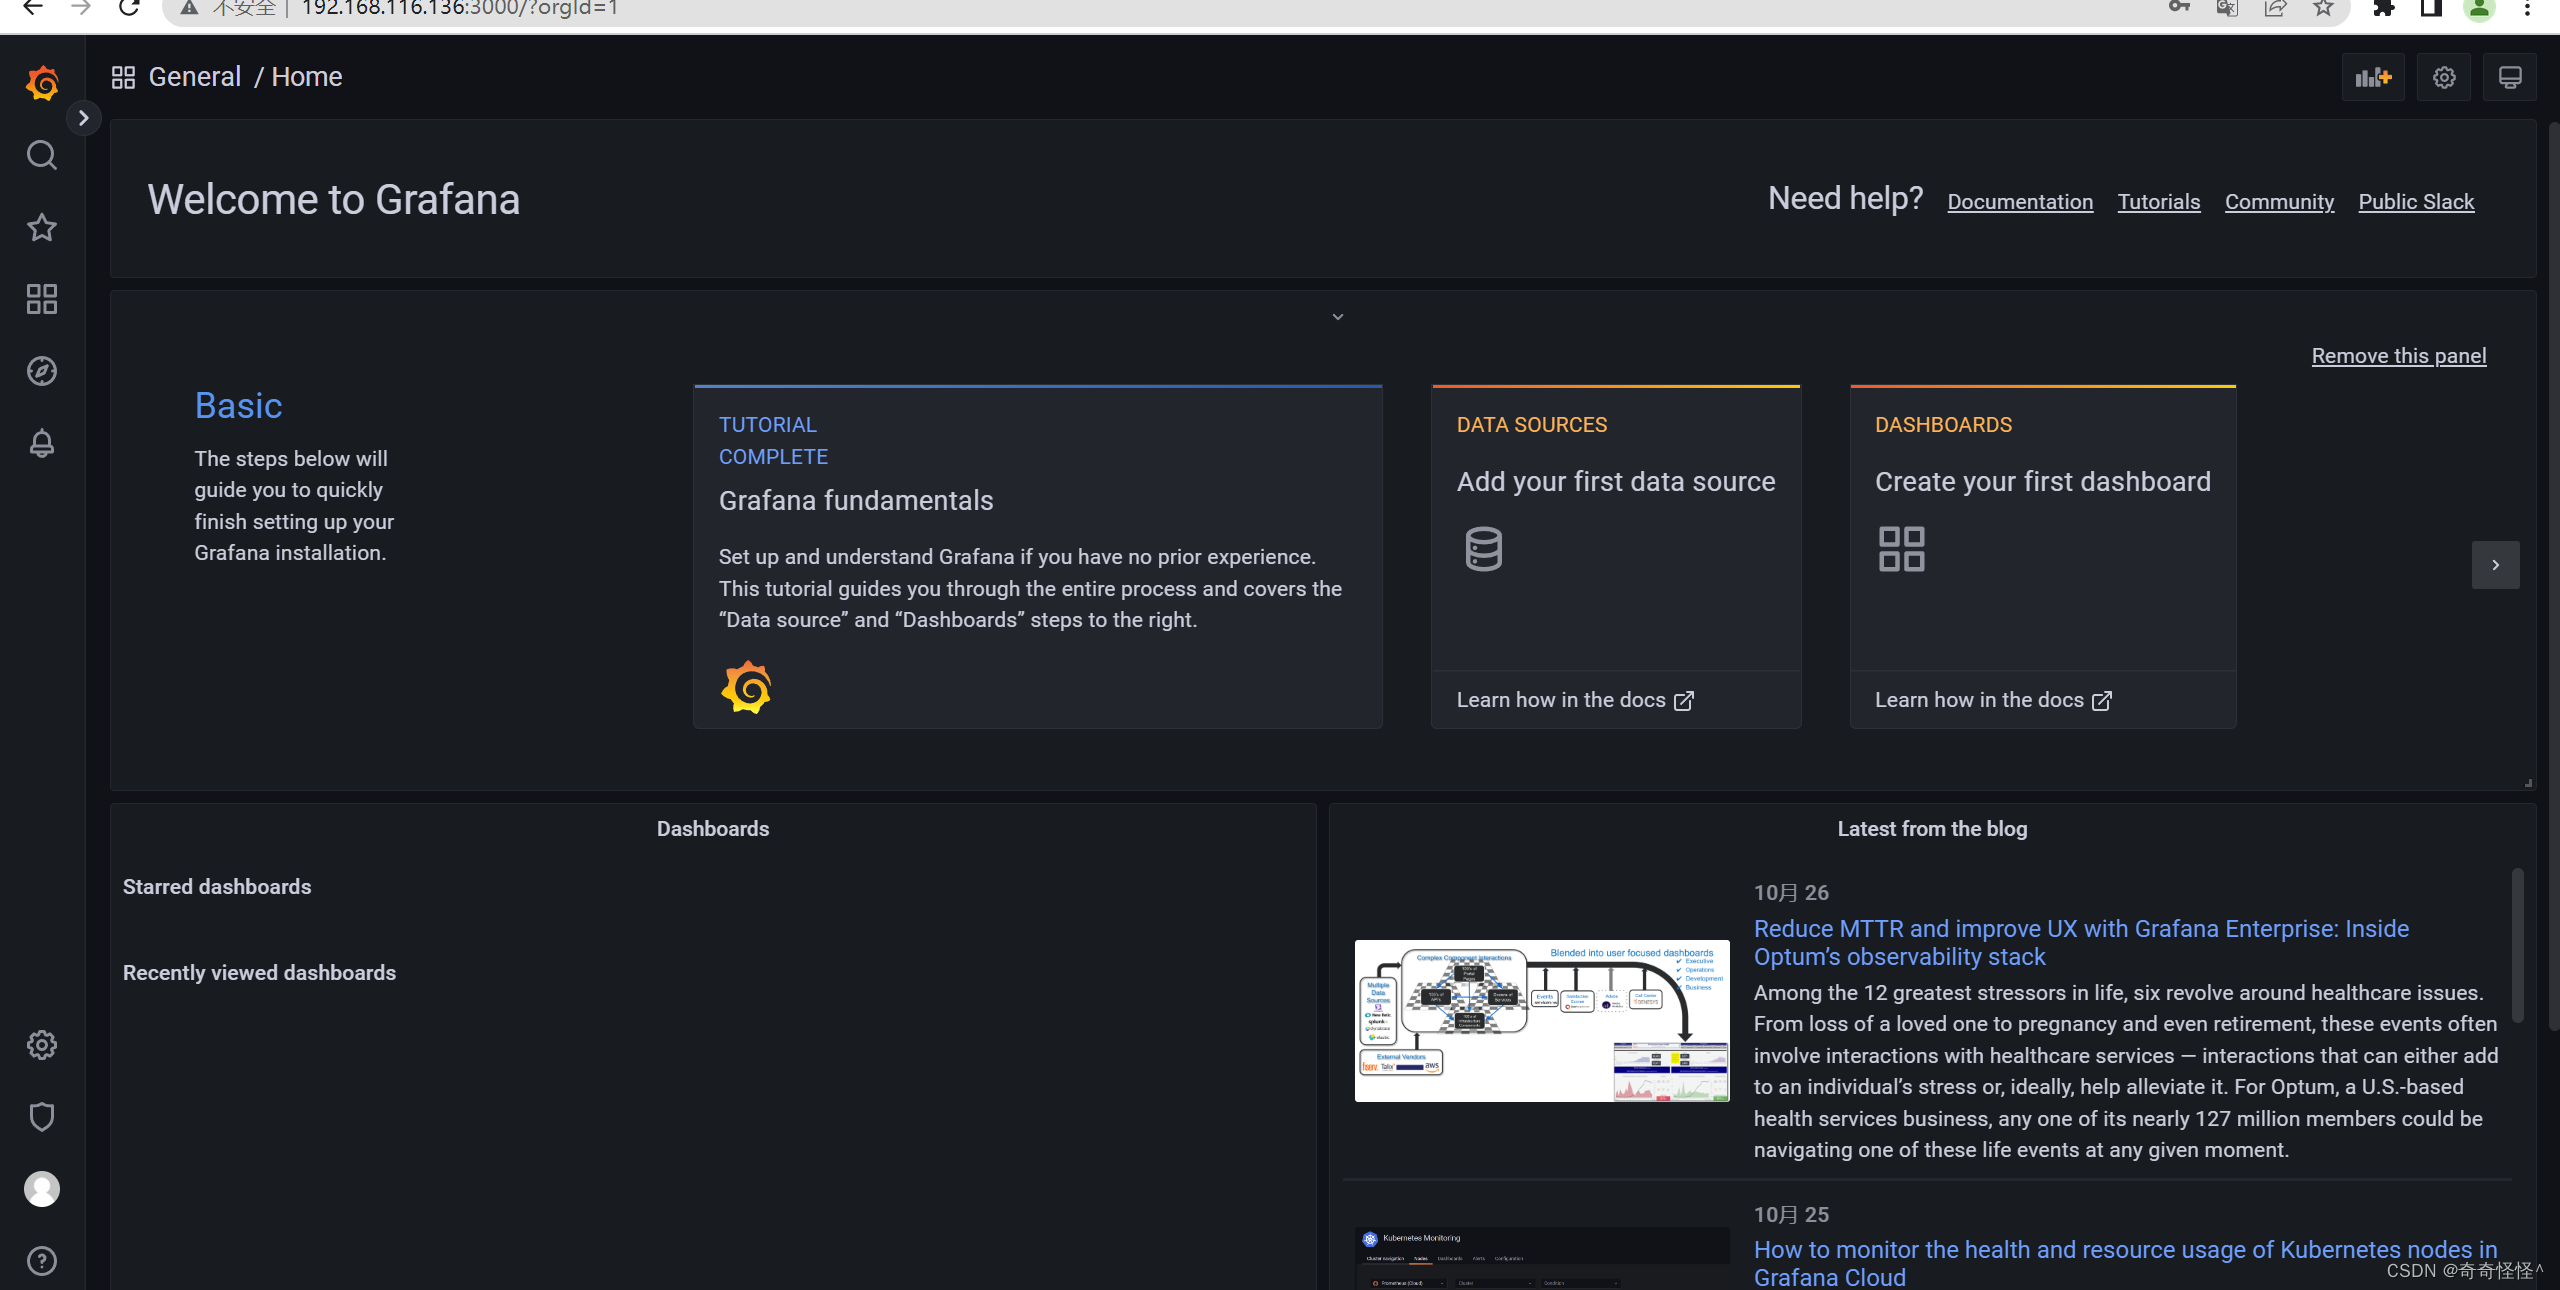
![[外链图片转存失败,源站可能有防盗链机制,建议将图片保存下来直接上传(img-WLMsKVTN-1666860016702)(F:\typorase\jpg\998.png)]](https://1000bd.com/contentImg/2024/05/23/9a97309439443b97.png)
通过浏览器访问 http:// grafana 服务器 IP:3000 就到了登录界面,使用默认的 admin 用户,admin 密码就可以登陆了
[外链图片转存失败,源站可能有防盗链机制,建议将图片保存下来直接上传(img-DeidyfSL-1666860016702)(F:\typorase\jpg\999.png)]
配置数据源
下面我们把 Prometheus 服务器收集的数据做为一个数据源添加到 grafana,让 grafana 可以得到 Prometheus 的数据。
![[外链图片转存失败,源站可能有防盗链机制,建议将图片保存下来直接上传(img-a1CttGWH-1666860016703)(F:\typorase\jpg\1000.png)]](https://1000bd.com/contentImg/2024/05/23/e1dfdd1088741608.png)
![[外链图片转存失败,源站可能有防盗链机制,建议将图片保存下来直接上传(img-aYo4EzNG-1666860016703)(F:\typorase\jpg\1001.png)]](https://1000bd.com/contentImg/2024/05/23/6a60c424e90b2792.png)
![[外链图片转存失败,源站可能有防盗链机制,建议将图片保存下来直接上传(img-7MIeE6SV-1666860016703)(F:\typorase\jpg\1002.png)]](https://1000bd.com/contentImg/2024/05/23/4aeb2644c190fa05.png)
-
相关阅读:
【Spring Cloud】Ribbon负载均衡
aspectj切面织入
Shell 从入门到精通(一)
安装 DolphinDB Python API
TCP怎么实现可靠传输
&2_PyTorch神经网络基础
全域营销怎么做?统一客户数据是起点
JavaScript简单倒计时
如何让脚本在任意地方可执行
Probability Calibration概率校准大比拼:性能、应用场景和可视化对比总结
- 原文地址:https://blog.csdn.net/y1701/article/details/127555748
