-
复现SCI文章系列教程 | 文章复现一(IF 7.3):文章讨论与文章分析套路讲解
一、本期复现文章
本系列教程从今天开始,前面想做,但是又没时间。作为佛系博主的我来说,这个系列教程算是一个长久的计划。会涉及医学和植物两大类。本系列教程详细情况可以看《复现SCI文章系列教程》.
我们第一篇复现的文章寻找的是的来自
Front Immunol (IF:7.3)题目为:“肾纤维化神经网络诊断模型的建立及免疫浸润特性的研究”。本篇文章发表日期在2023年6月,也算是比较新的文章。
1.1文章标题:
**英文标题:**Construction of a neural network diagnostic model for renal fibrosis and investigation of immune infiltration characteristics
**翻译标题:**肾纤维化神经网络诊断模型的建立及免疫浸润特性的研究
1.2 文章网址:
https://pubmed.ncbi.nlm.nih.gov/37359552/- 1

二、文章摘要
Background: 近年来,世界范围内肾纤维化的发病率不断上升,极大地增加了社会负担。然而,该疾病的诊断和治疗工具不足,因此需要筛选潜在的生物标志物来预测肾纤维化。
Methods: 利用基因表达综合数据库(Gene Expression Omnibus, GEO),我们获得了来自肾纤维化患者和健康个体的两个基因阵列数据集(GSE76882和GSE22459)。我们鉴定了肾纤维化和正常组织之间的差异表达基因(DEGs),并使用机器学习分析了可能的诊断生物标志物。采用受试者工作特征(ROC)曲线评价候选标志物的诊断效果,并采用逆转录定量聚合酶链反应(RT-qPCR)验证其表达。采用CIBERSORT算法测定肾纤维化患者中22种免疫细胞的比例,研究生物标志物表达与免疫细胞比例的相关性。最后,我们建立了肾脏纤维化的人工神经网络模型。
Results: DOCK2、SLC1A3、SOX9和TARP 4个候选基因被确定为肾纤维化的生物标志物,其ROC曲线下面积(AUC)值均大于0.75。接下来,我们通过RT-qPCR验证这些基因的表达。随后,我们通过CIBERSORT分析揭示了肾纤维化组免疫细胞的潜在紊乱,发现免疫细胞与候选标记物的表达高度相关。
Conclusion: DOCK2、SLC1A3、SOX9和TARP被鉴定为肾纤维化的潜在诊断基因,并鉴定出最相关的免疫细胞。我们的发现为肾纤维化的诊断提供了潜在的生物标志物。
三、文章的思路与方法
3.1 思路

Fig. 1A Flowchart of the research以及吧整篇文章的框架以及罗列出来,基本思路比较清晰的。3.2 方法
- GEO数据下载:从GEO数据库下载GSE22459数据集和GSE76882数据集中获得患病样本和正常样本,作为训练集。
- 进行差异分析,获得DEG数据集
- 进行WGCNA分析
- 取DEG和WGCNA数据集的交集进行后续分析
- 交集数据进行PPI分析
- 进行LASSO和SVM-RFE分析获得4个基因
- 进行gene expression, ROC,GSEA功能富集、免疫细胞与候选标志物相关性分析和实验验证(说白了就是对前面获得4个基因的功能验证)
- ENDING
- 发表文章,发表在IF为7.3的期刊上
- 借此文章,完成任务之一、考核目标、获得升职机会或获得2023奖学金*W元
四、文章复现声明
我们复现文章,可能不会获得与作者一样的结果(不同的人来做,获得结果不一样)。但是,我们的确保按照作者的思路完成文章重要的部分。也帮助大家根据我们的教程,可以做相关的分析,对于我们来来,这就够了。学到自己需要的即可。
五、文章结果文件

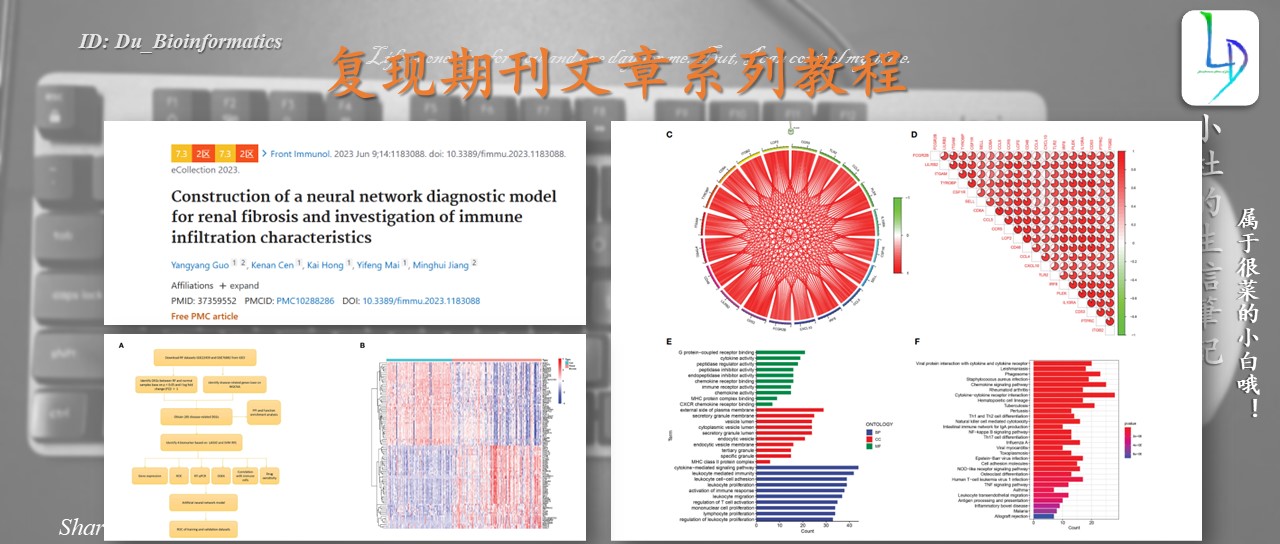
Figure 1 Identification of renal fibrosis-related DEGs. (A) Flowchart of the research. (B) Heat map of differentially expressed genes between renal fibrosis samples and healthy samples. © Volcano plot of differentially expressed genes between renal fibrosis samples and healthy samples. (D) weighted correlation network analysis of train cohort. (E) Correlation between blue module and renal fibrosis. (F) Venn of DEGs and WGCNA.

Figure 2 Enrichment analisis of renal fibrosis-related DEGs. (A) PPI network of renal fibrosis-related DEGs. (B) The number of connection nodes of hub genes. (C, D) Correlations between top 20 hub genes. (E) The top 10 most significantly enriched GO terms. (F) The top 30 most significantly enriched KEGG pathways.

Figure 3 Identification of diagnostic markers for renal fibrosis. (A, B) Tuning feature screening in the LASSO model. (C, D) A plot of biological marker screening via the SVM-RFE arithmetic. (E) Venn graph displaying 4 diagnosis biomarkers shared by LASSO and SVM-RFE.

Figure 4 The ROC curve and expression of candidate biomarkers. (A) The ROC curve of DOCK2, SOX9, SLC1A3 and TARP. (B) The expression of DOCK2, SOX9, SLC1A3 and TARP in GSE76882. © RT-qPCR of DOCK2, SOX9, SLC1A3 and TARP in HK-2 cells with or without TGF-β. (D) The expression of DOCK2, SOX9, SLC1A3 and TARP in patients with renal fibrosis and healthy individuals.

Figure 5 Immune cell infiltration in renal fibrosis samples and control samples. (A) Comparison of 22 immune cell types in renal fibrosis samples and control samples. (B–K) Correlation between candidate biomarkers and neutrophils, macrophages M1, activated mast cells.

Figure 6 Correlation between four candidate biomarkers and immune cells. (A) DOCK2. (B) SLC1A3. © SOX9. (D) TARP. Correlation between four candidate biomarkers and immune related genes. (E) Chemokine. (F) MHC. (G) Receptor. (H) Immune checkpoint.

Figure 7 Gene set enrichment analysis (GSEA) identifies signaling pathways involved in the candidate biomarkers. (A) DOCK2. (B) SLC1A3. © SOX9. (D) TARP.
六、下期计划
我们的下一期开始复现本系列教程及本篇文章内容。
小杜的生信筆記,主要发表或收录生物信息学的教程,以及基于R的分析和可视化(包括数据分析,图形绘制等);分享感兴趣的文献和学习资料!!
-
相关阅读:
CameraMetadata 知识学习整理
对于BFC的理解
ARM开发流程相关工具简介
2022企业级常见面试题
刚来公司就接了一个不发版直接改代码的需求
从源码解析Go exec timeout 实现机制
S7-200SMART案例分析——运动控制编程三轴控制(二)
【Nginx】基本使用及配置-项目部署
【副业合集】60个正规可做兼职的网站
怎么从A和B仓库执行分别fetch操作?
- 原文地址:https://blog.csdn.net/kanghua_du/article/details/132841402